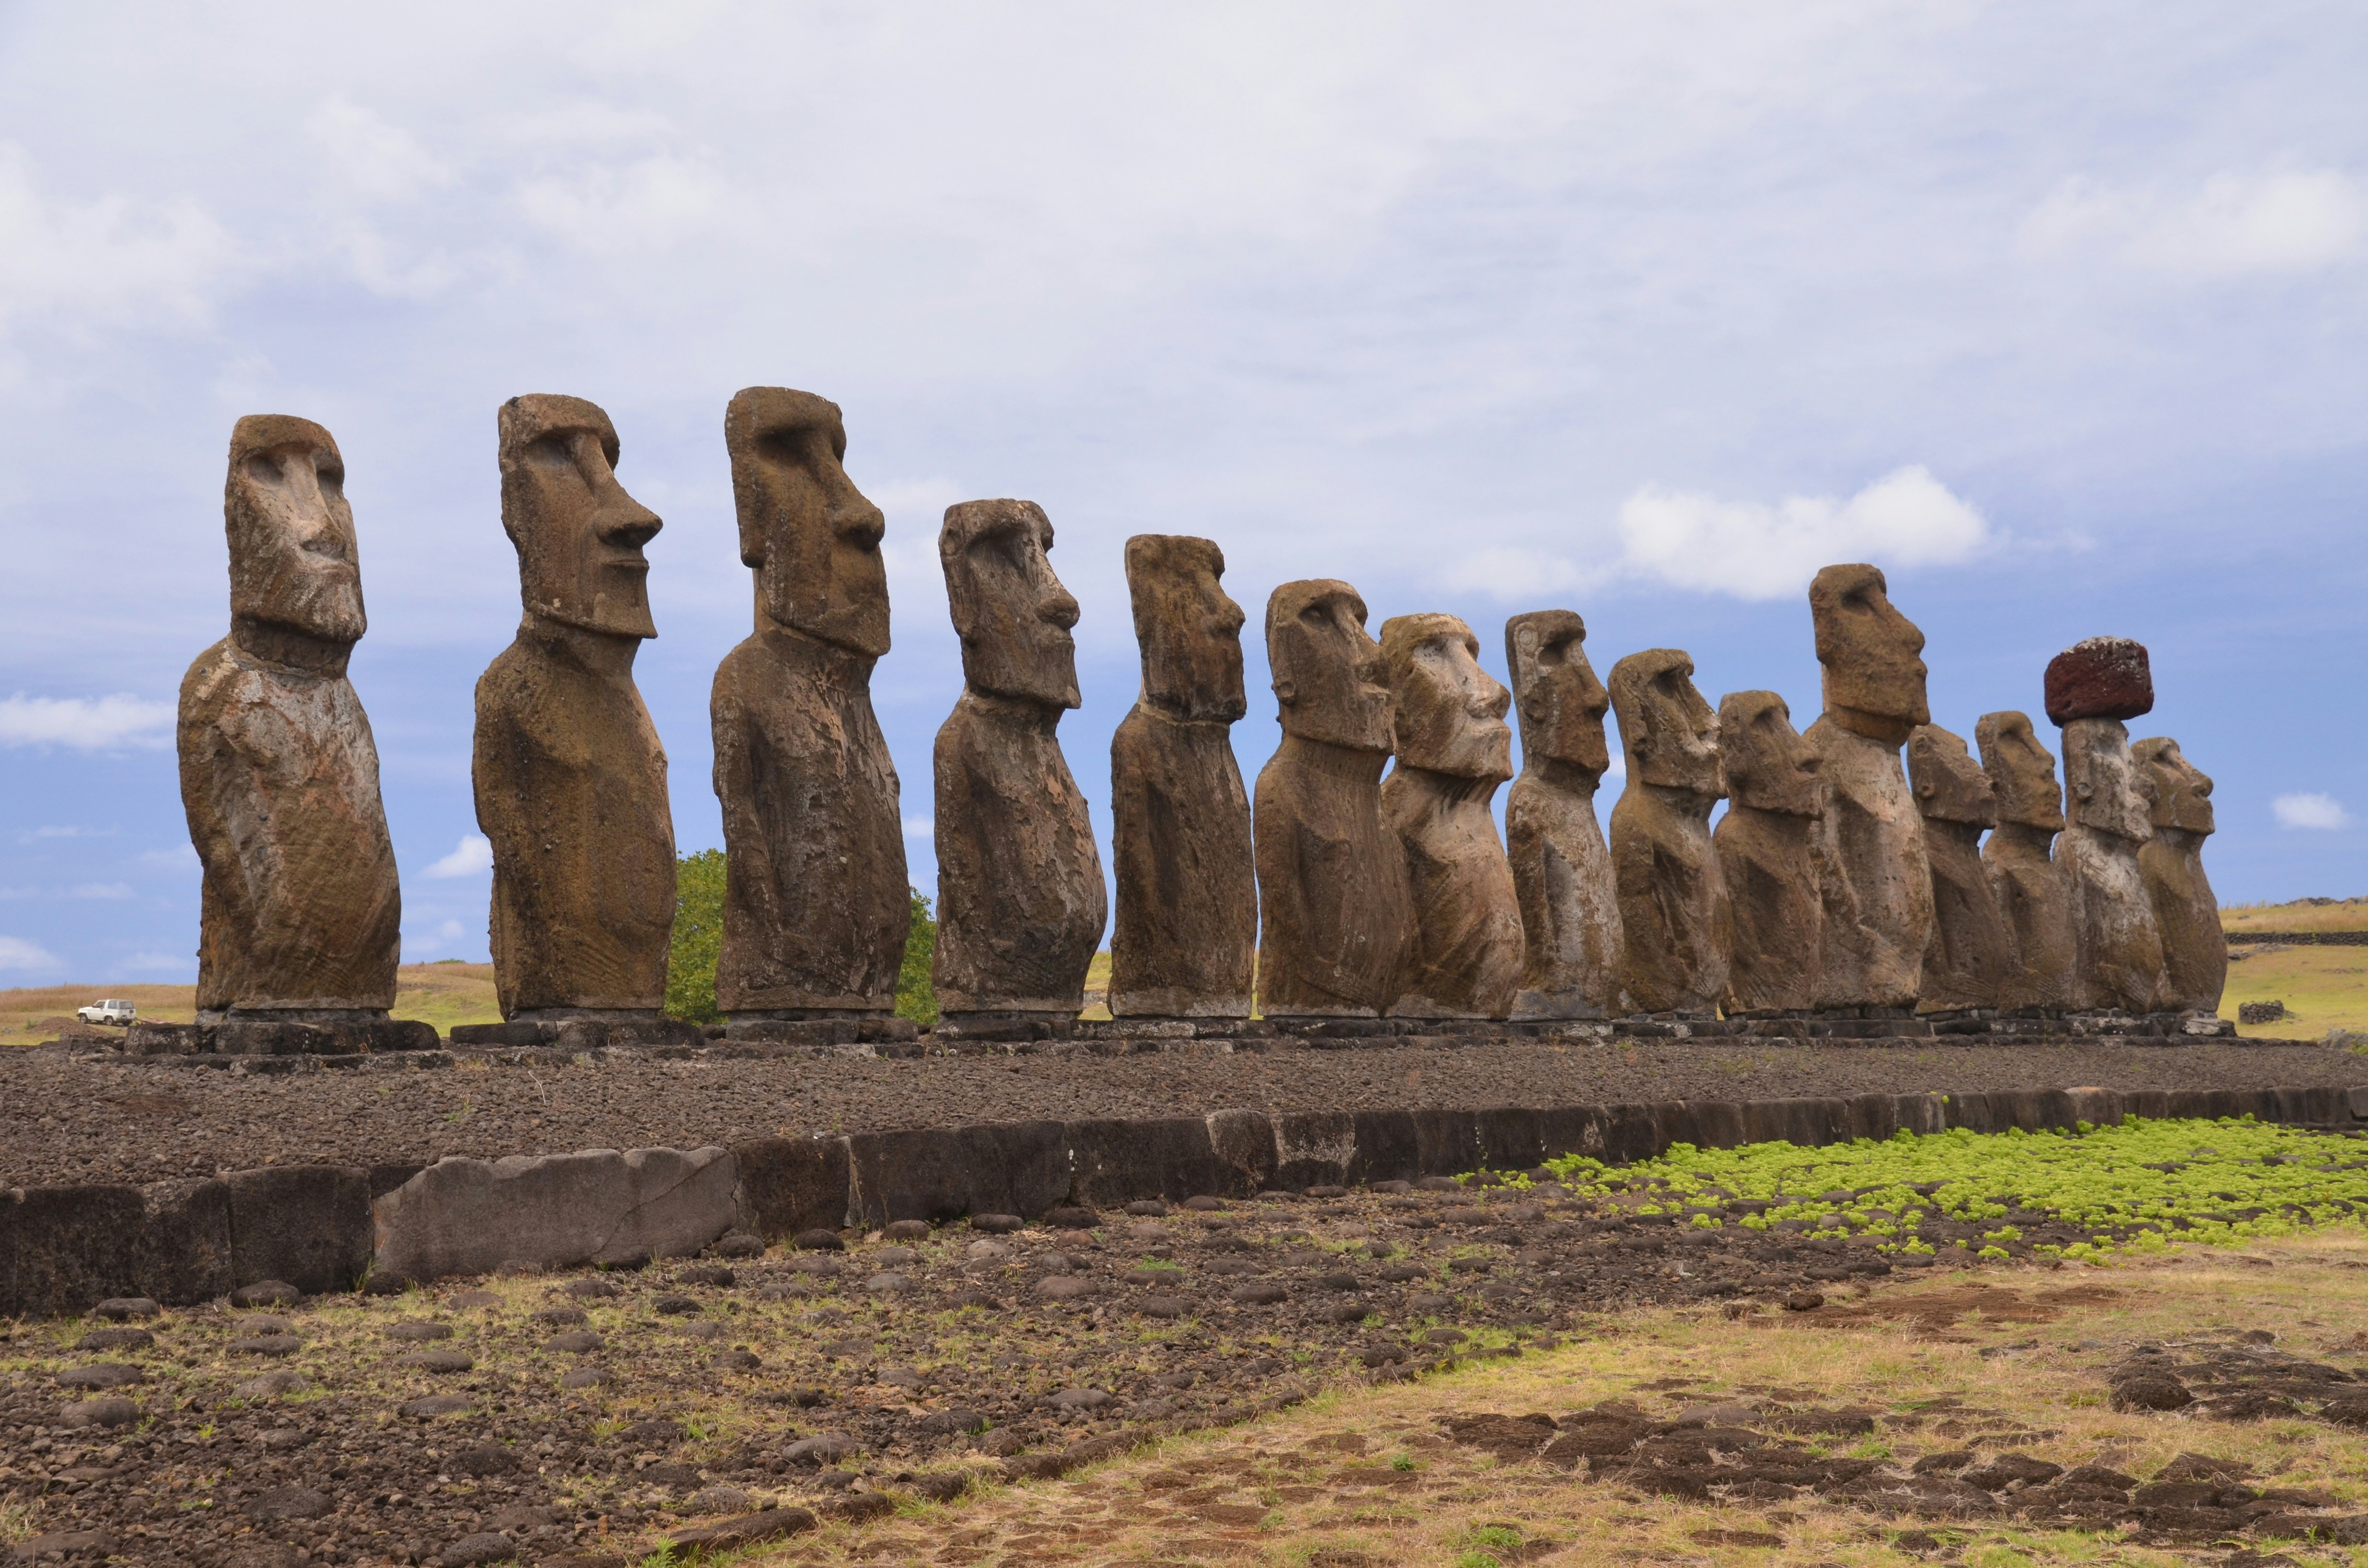
Rapa Nui (Easter Island or Isla de Pascua) in Chile
In this section, we’ll kick-off our mapmaking skills using the tmap package. Your task will be to make a map of Rapa Nui (Easter Island or Isla de Pascua). Rapa Nui is a volcanic island in Polynesia and territory of Chile. It is widely known for monumental statues called moai, but it is also a place of geoscientific inquiry. Several research programs about the island’s volcanic history, petrology, and human-environment interactions exist.
Source Materials
The following materials are modified from the tmap book.
Learning Objectives
- Read in spatial objects with
st_read()andread_stars() - Create map with single spatial object
- Create map with multiple spatial objects
- Use different types of
tmapplotting formats (e.g.tm_polygons(),tm_fill(),tm_dots(), etc.) - Include essential map elements (e.g. scale bar & north arrow or graticules)
- Create an interactive map
- Challenge: Reproduce map using
ggplot2instead oftmap
1. Get Started
- Create a version-controlled R Project
- Add (at least) a subfolder to your R project:
data - Create a Quarto document
Let’s load all necessary packages:
library(here)
library(tidyverse)
library(sf)
library(stars)
library(tmap)
Next, let’s download some data from Rapa Nui. Unzip and move this to your version-controlled R Project’s data folder.
- Read in the spatial objects for Rapa Nui:
ei_points: file contains several points on the island- Use the pipe operator to
filter()output for points representing volcanoes
- Use the pipe operator to
ei_elev: raster with elevation dataei_borders: polygon with the island outlineei_roads: lines contains a road network for the island
ei_points <- st_read(here("data", "easter_island", "ei_points.gpkg")) |>
  filter(type == "volcano")
ei_elev <- read_stars(here("data", "easter_island", "ei_elev.tif"))
ei_borders <- st_read(here("data", "easter_island", "ei_border.gpkg"))
ei_roads <- st_read(here("data", "easter_island", "ei_roads.gpkg"))
2. Create a single-object map with tmap
- Create a map of the outline Rapa Nui using
tm_shape() + tm_borders()
Solution
# Add Easter Island vector in default gray
tm_shape(ei_borders) +
  tm_borders() +
# Set general map layout options
  tm_layout(main.title = "Easter Island")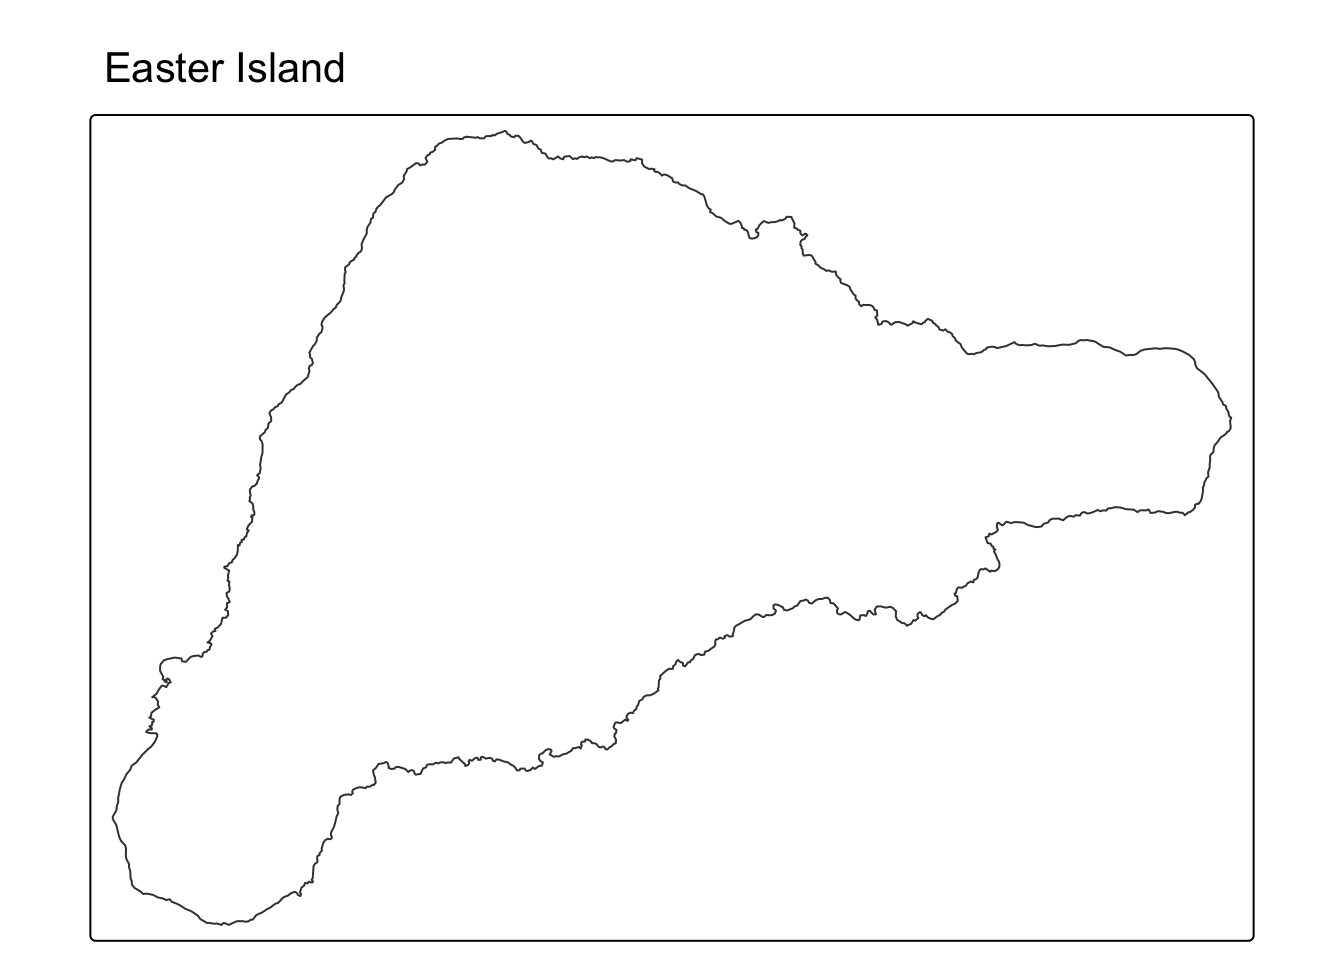
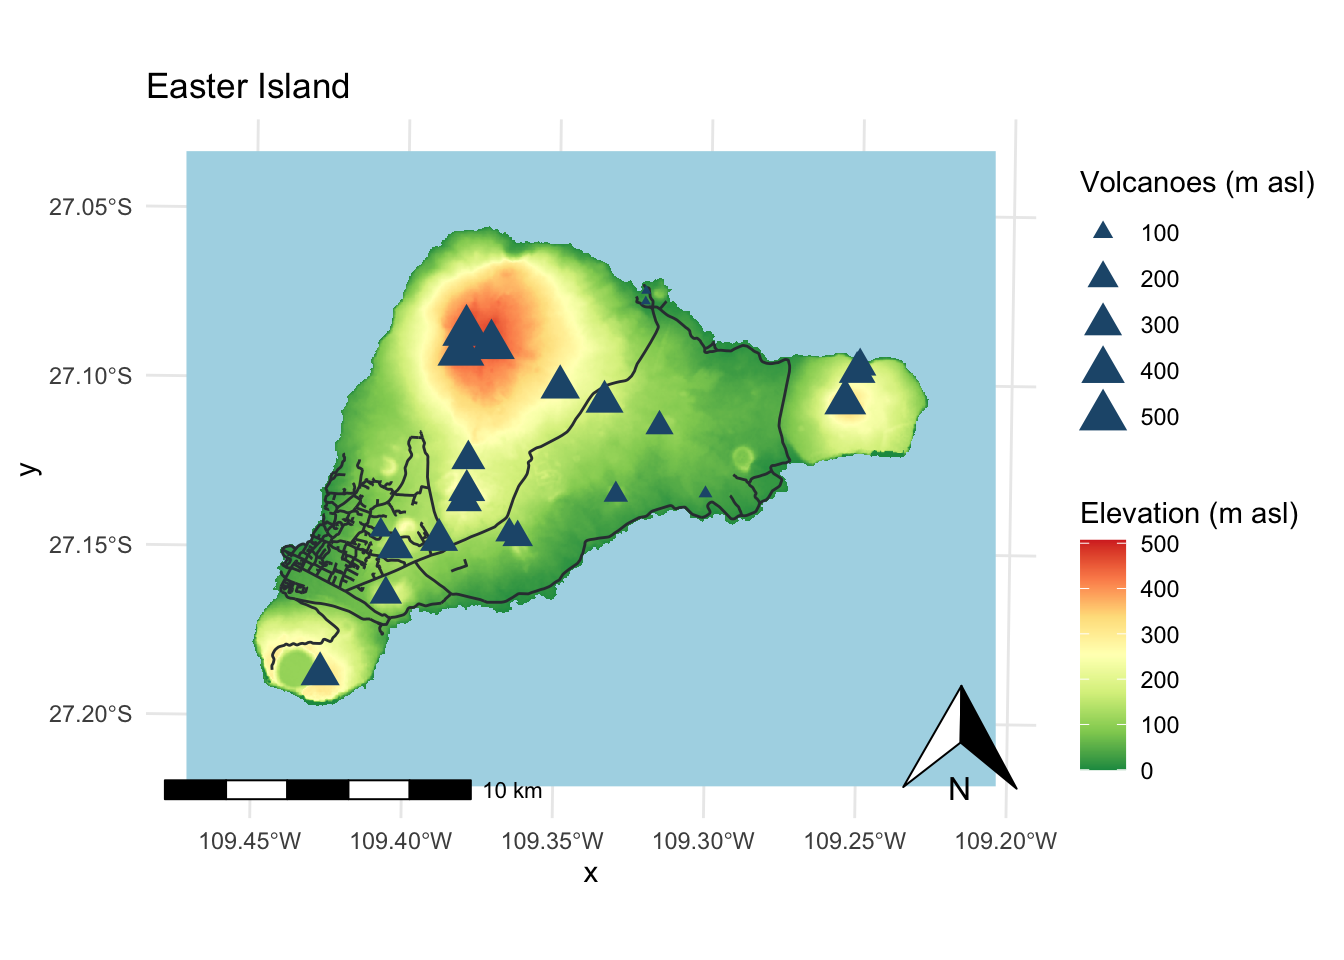
3. Create a multiple-object map with tmap
Expand on your single-object map to create a map of Rapa Nui and…
- …denote the island’s borders and continuous elevation
- …denote the island’s volcanoes and roads
- …play with the color palette and essential map elements
Solution
ei_map <- tm_shape(ei_elev) +
  tm_graticules() +
  tm_raster(col.scale = tm_scale_continuous(values = "-rd_yl_gn"),
            col.legend = tm_legend("Elevation (m asl)")) +
  tm_shape(ei_borders) +
    tm_borders() +
  tm_shape(ei_roads) +
    tm_lines() +
  tm_shape(ei_points) +
    tm_symbols(shape = 24,
               size = "elevation",
               size.legend = tm_legend("Volcanoes (m asl)")) +
  tm_compass(position = c("right", "top")) +
  tm_scalebar() +
  tm_title("Easter Island")

ei_map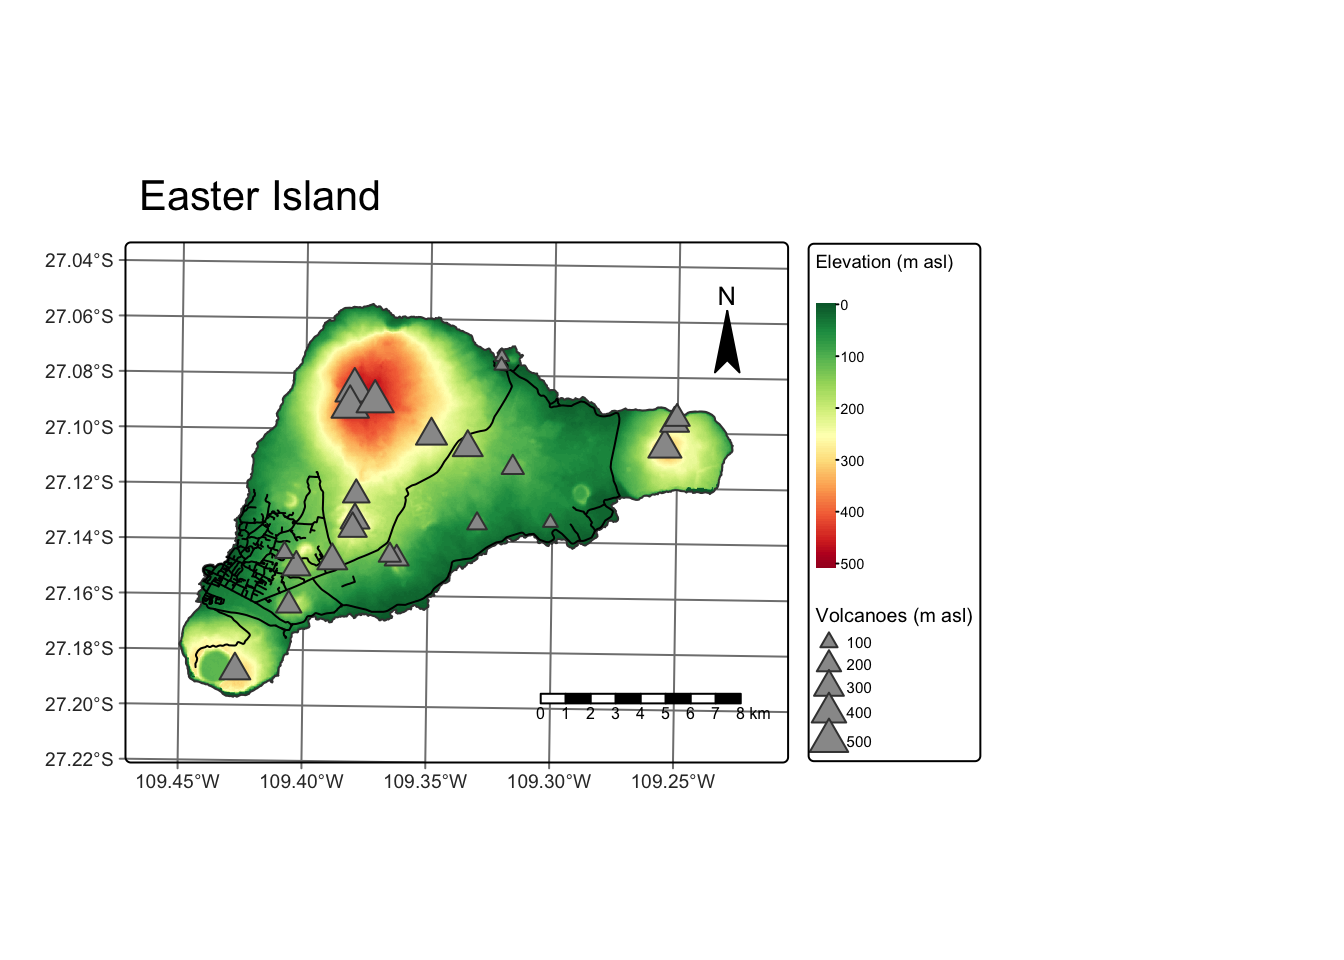
4. Create an interactive map with tmap
- Switch from the default
"plot"mode to"view"
Solution
tmap_mode("view") # Convert default static map to interactive map ℹ tmap mode set to "view".ei_map5. Create a multiple-object map with ggplot2
More map making in R
There are MANY different ways to make maps in R, all with different pros/cons. Check out this resource for examples of what map making looks like in ggplot2, leaflet, and more!
As a bonus challenge, reproduce your multiple-object map from earlier using ggplot2!
Solution
# extract lat & long from geom column
volcanoes_point <- ei_points %>%
  mutate(lon = unlist(map(ei_points$geom,1)), # longitude = first component (x)
lat = unlist(map(ei_points$geom,2))) # latitude = second component (y)ggplot() +
# first add Easter Isand borders
geom_sf(data = ei_borders, color = "#212529") +
# add elevation raster
geom_stars(data = ei_elev) +
scale_fill_distiller(name = "Elevation (m asl)", # legend title with units
palette = "RdYlGn", # red-yellow-green palette (no need to reverse)
na.value = "lightblue") + # set NA color (background ocean)
# add road vector
geom_sf(data = ei_roads, color = "#343a40") +
# add volcano vector
geom_point(data = volcanoes_point,
aes(x = lon, y = lat,
size = elevation), # point size depends on attribute value
shape = 17, # triangle
color = "#22577a") +
scale_size_continuous(name = "Volcanoes (m asl)") + # legend title with units
ggspatial::annotation_north_arrow(location = "br", # bottom right
which_north = "true") + # point to north pole
ggspatial::annotation_scale(location = "bl", # bottom left
width_hint = 0.5) + # proportion of map area the scalebar should occupy
labs(title = "Easter Island") +
theme_minimal()