library(tidyverse)
library(sf)
library(terra)
library(spData)
Source Materials
The following materials are modified from Geocomputation with R by Robin Lovelace.
Learning Objectives
- Use
terrafunctionsaggregate()andresample()to create a new raster - Use
terrafunctionsas.polygons()to convert a raster to polygons (vector)
1. Get Started
- Create a version-controlled R Project
- Create a Quarto document
Let’s load all necessary packages:
You will be working with the following datasets: - High points in New Zealand, obtained from spData - Artificial grain dataset (with three classes: clay, silt, and sand), obtained from spData
nz_height <- nz_height
grain <- terra::rast(system.file("raster/grain.tif", package = "spData"))
3. High elevation points in New Zealand/Aotearoa
- Subset points higher than 3100 meters in
nz_height
Solution
nz_height3100 <- nz_height |>
dplyr::filter(elevation > 3100) # rows where column elevation > 3100 meters- Create a template raster with
rast(), where the resolution is 3 km x 3 km, with the same extent and CRS as the previous subset
Solution
nz_template <- rast(terra::ext(nz_height3100), # Set extent based on nz_height3100
                    resolution = 3000,
crs = terra::crs(nz_height3100)) # Set CRS based on nz_height3100- Count numbers of the highest points in each grid cell
Solution
nz_raster <- rasterize(nz_height3100, nz_template, # Convert vector points to raster data
fun = "length") # "length" returns a count per cellplot(nz_raster, main = "Number of elevation points > 3100 in each grid cell")
plot(st_geometry(nz_height3100), add = TRUE)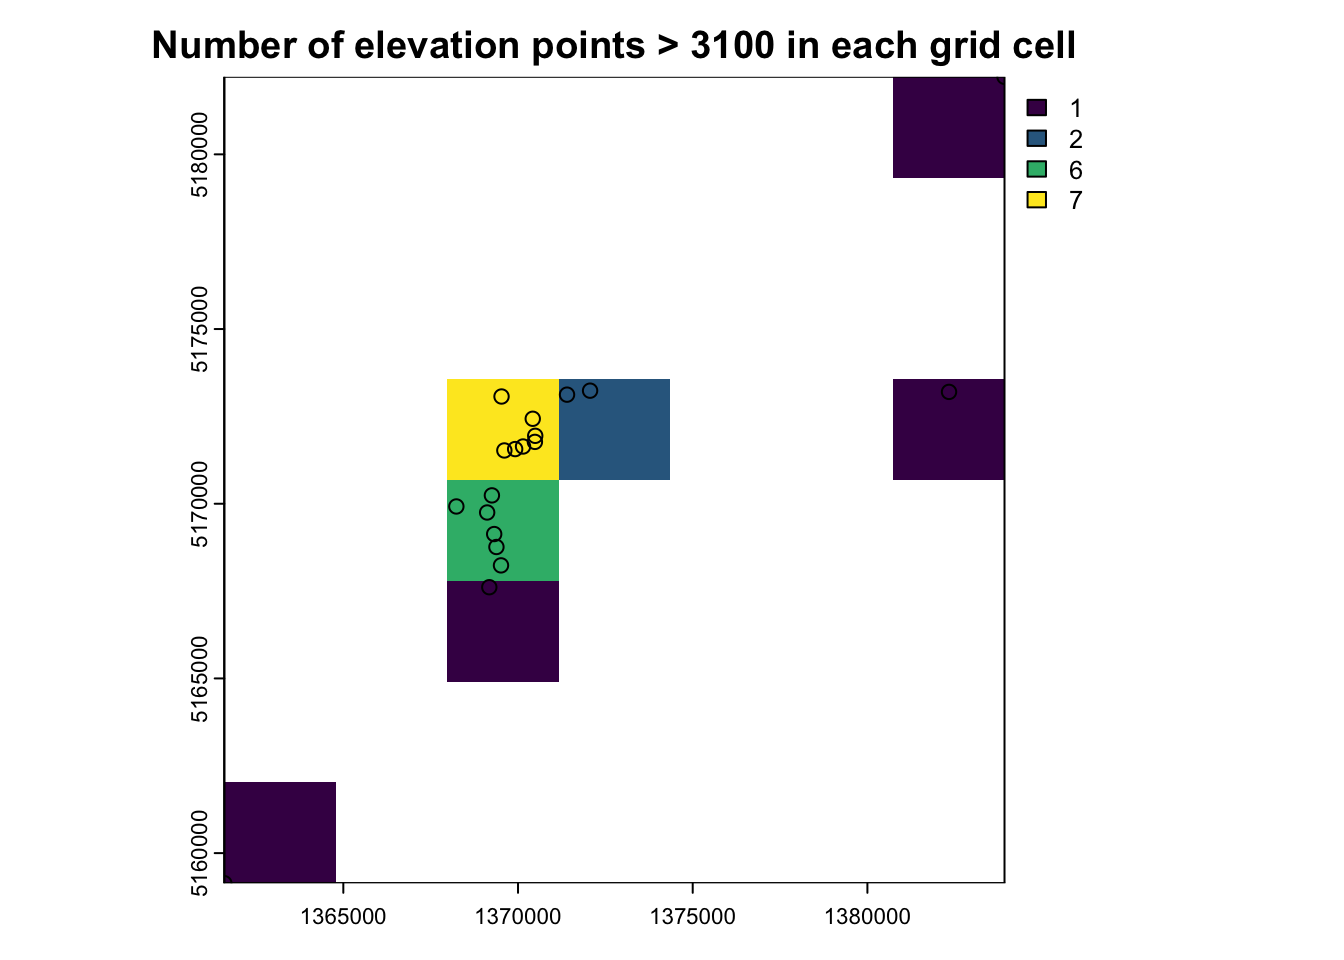
- Find the maximum elevation in each grid cell
Solution
nz_raster2 <- rasterize(nz_height3100, nz_template, # Convert vector points to raster data
fun = max) # "max" returns maximum elevation value per cellplot(nz_raster2, main = "Maximum elevation in each grid cell ")
plot(st_geometry(nz_height3100), add = TRUE)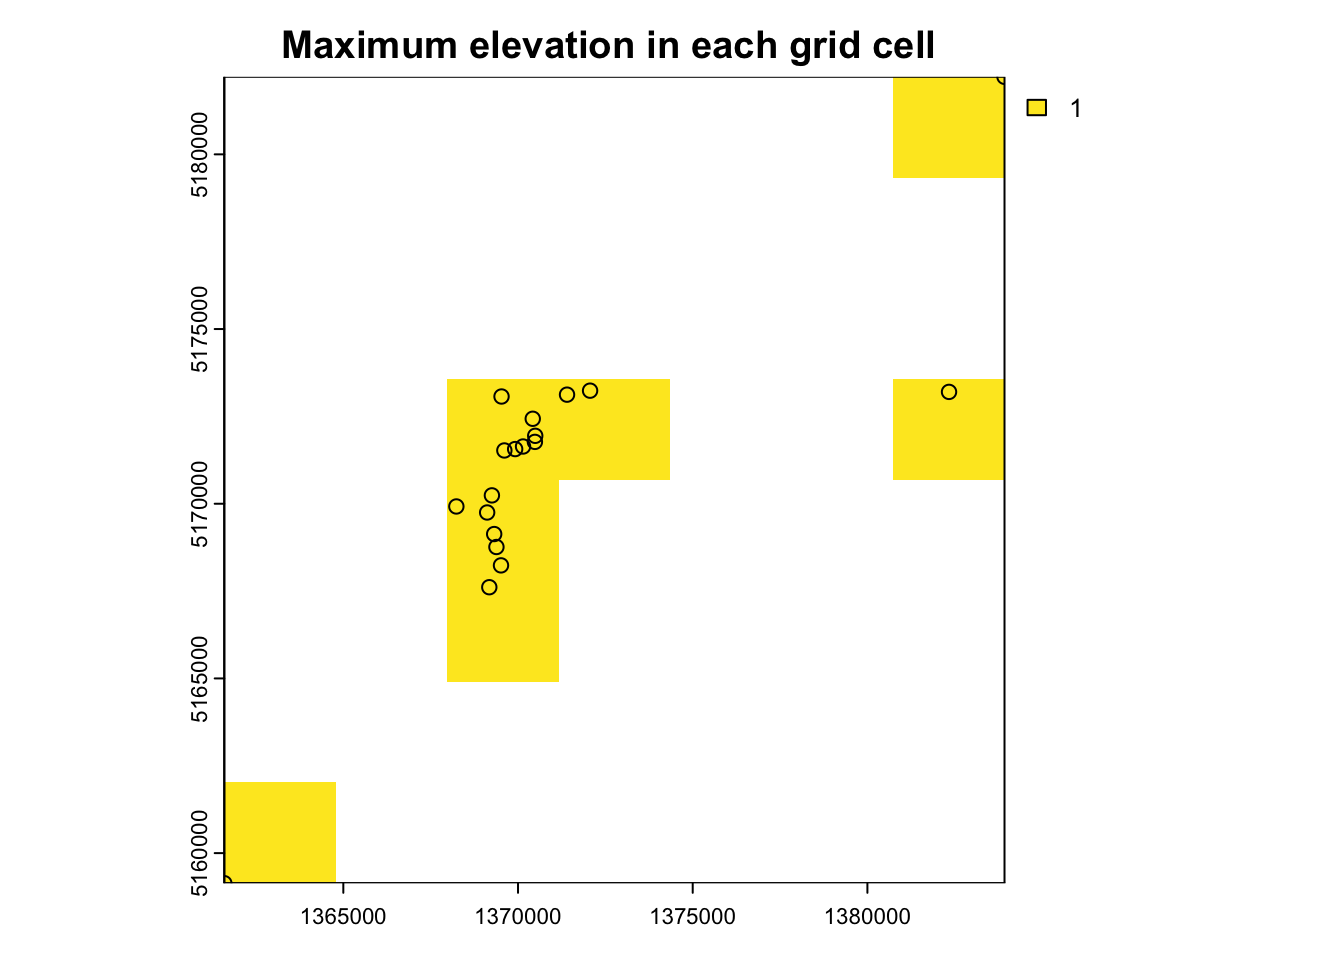
- With the raster template, complete the following:
- Aggregate raster that counts the highest points in New Zealand/Aotearoa, to reduce its geographic resolution by half
- Resample back to the original resolution
Solution
nz_raster_low <- aggregate(nz_raster,
                           fact = 2, # Reduce resolution by combining 2 cells in each direction into larger cells
                           fun = sum, na.rm = TRUE) # Sum values of all cells for resulting elevation value
# Convert resolution back to original 3kmx3km resolution
nz_resample <- resample(nz_raster_low, nz_raster)plots <- c(nz_raster, nz_resample)
labs <- c("Original 3 x 3 km", "Resample 3 x 3 km")
plot(plots, main = labs)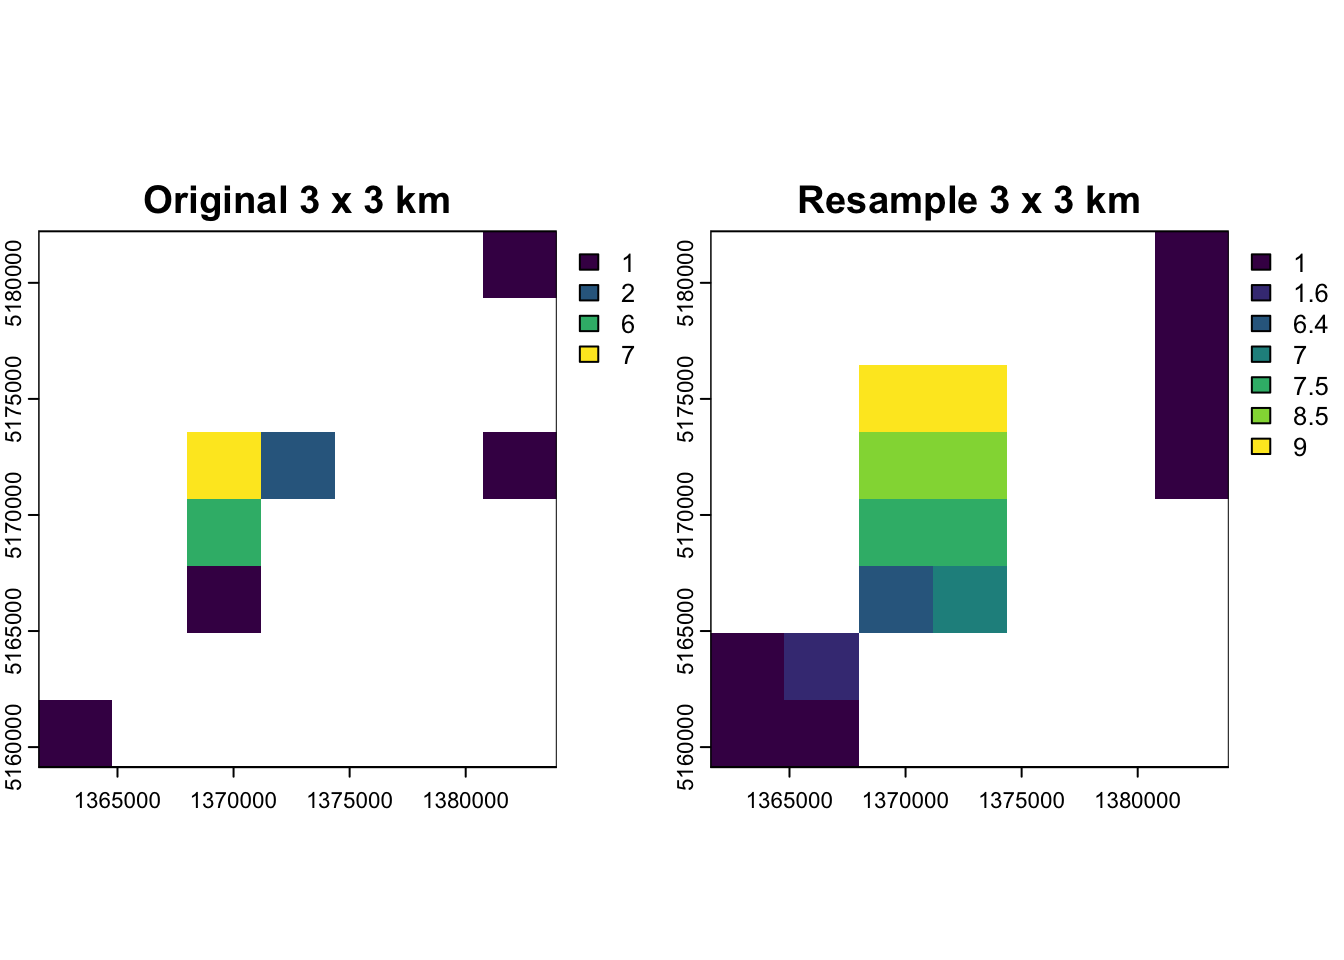
plot(nz_raster_low, main = "Resample 6 x 6 km")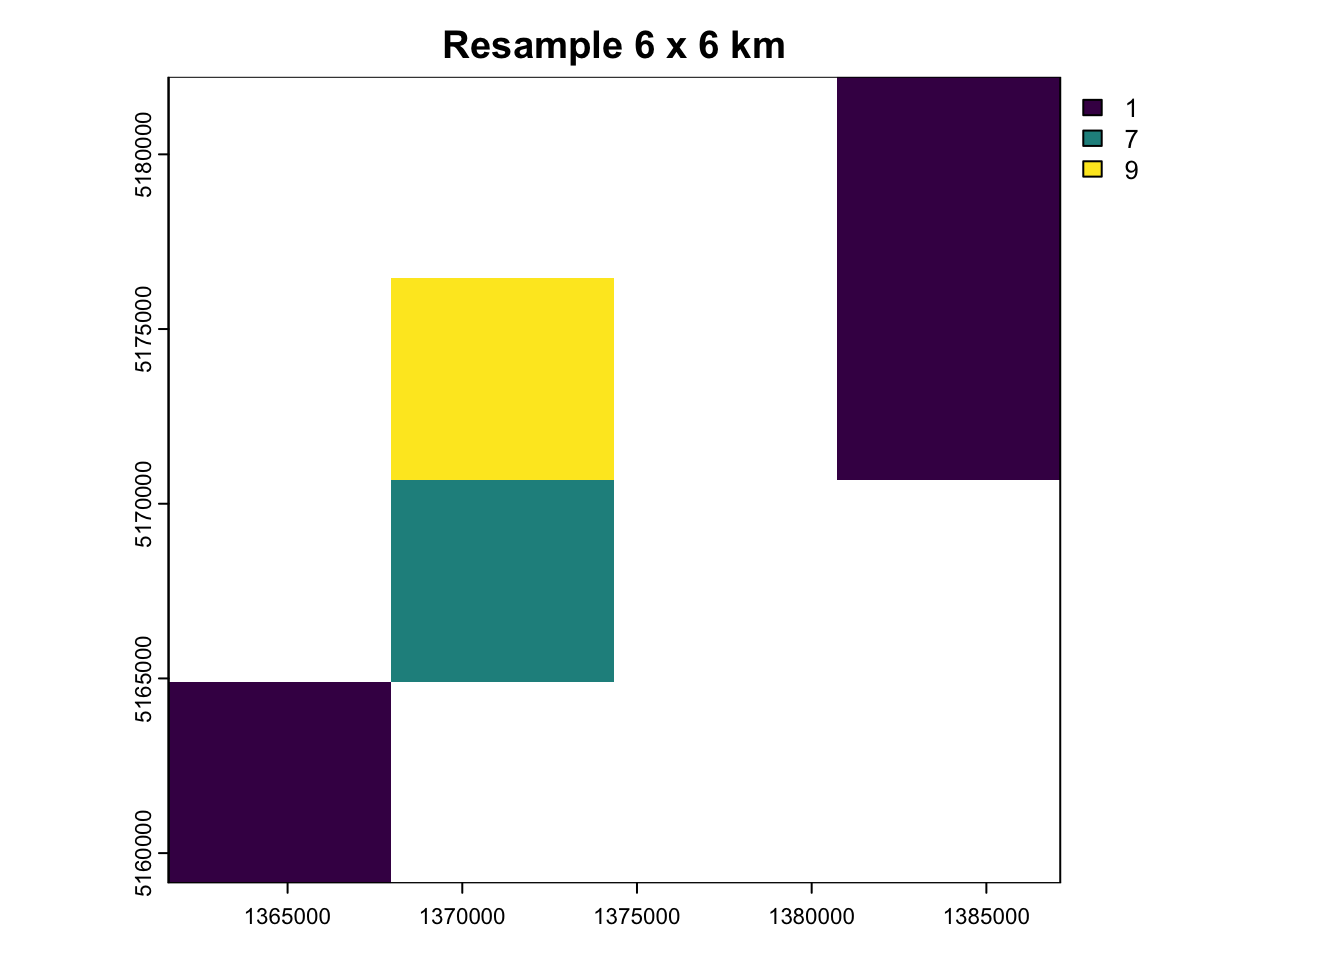
4. Vectorize grain raster
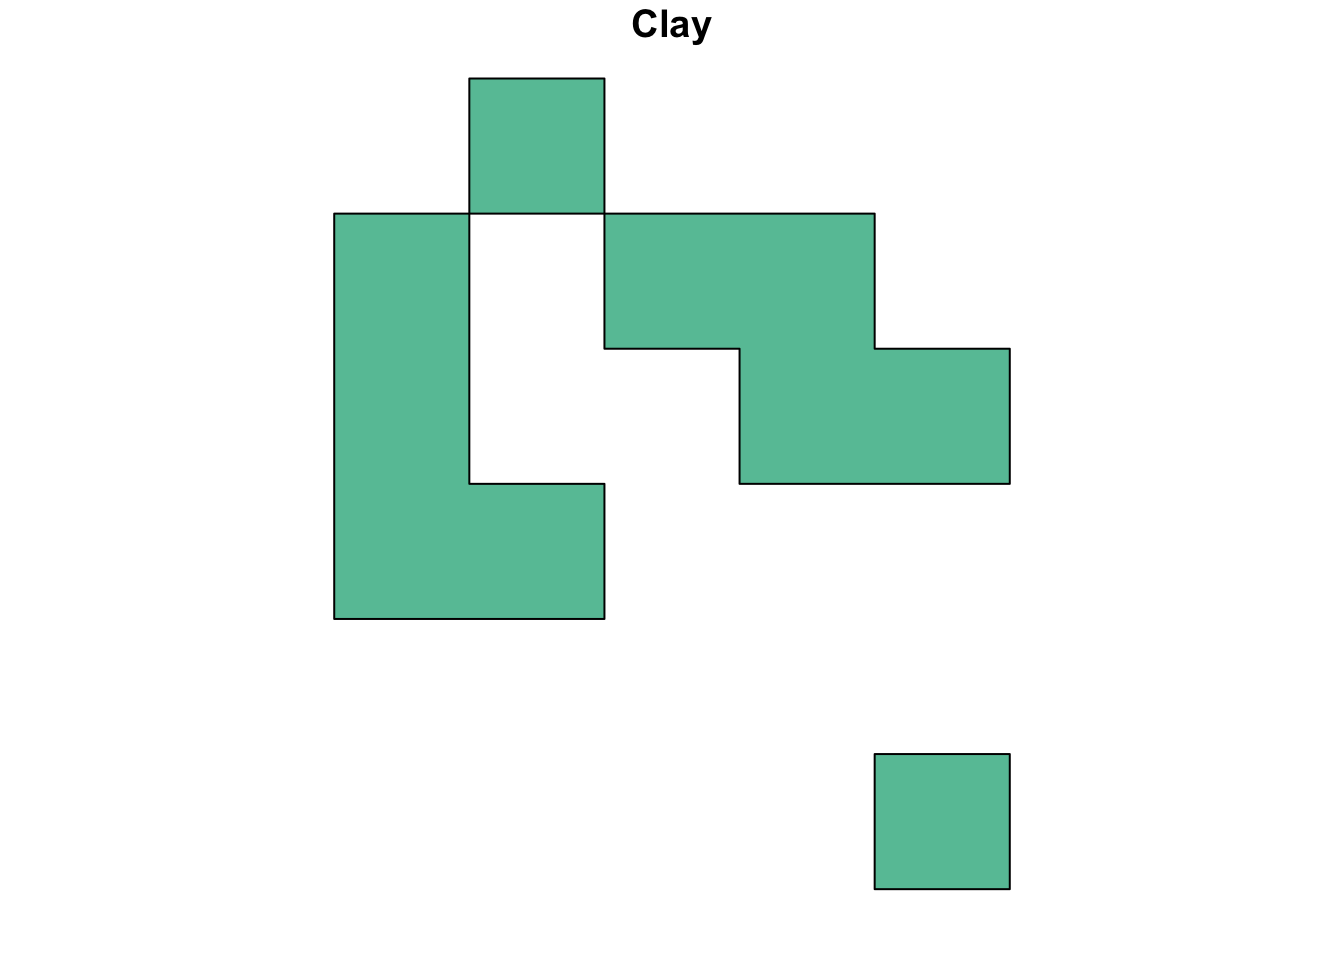
- Polygonize
grainand filter to only keep squares that represent clay
Solution
# Convert raster data to polygon vector data
grain_poly <- as.polygons(grain) %>%
  st_as_sf()

plot(grain, main = "Grain (Raster)")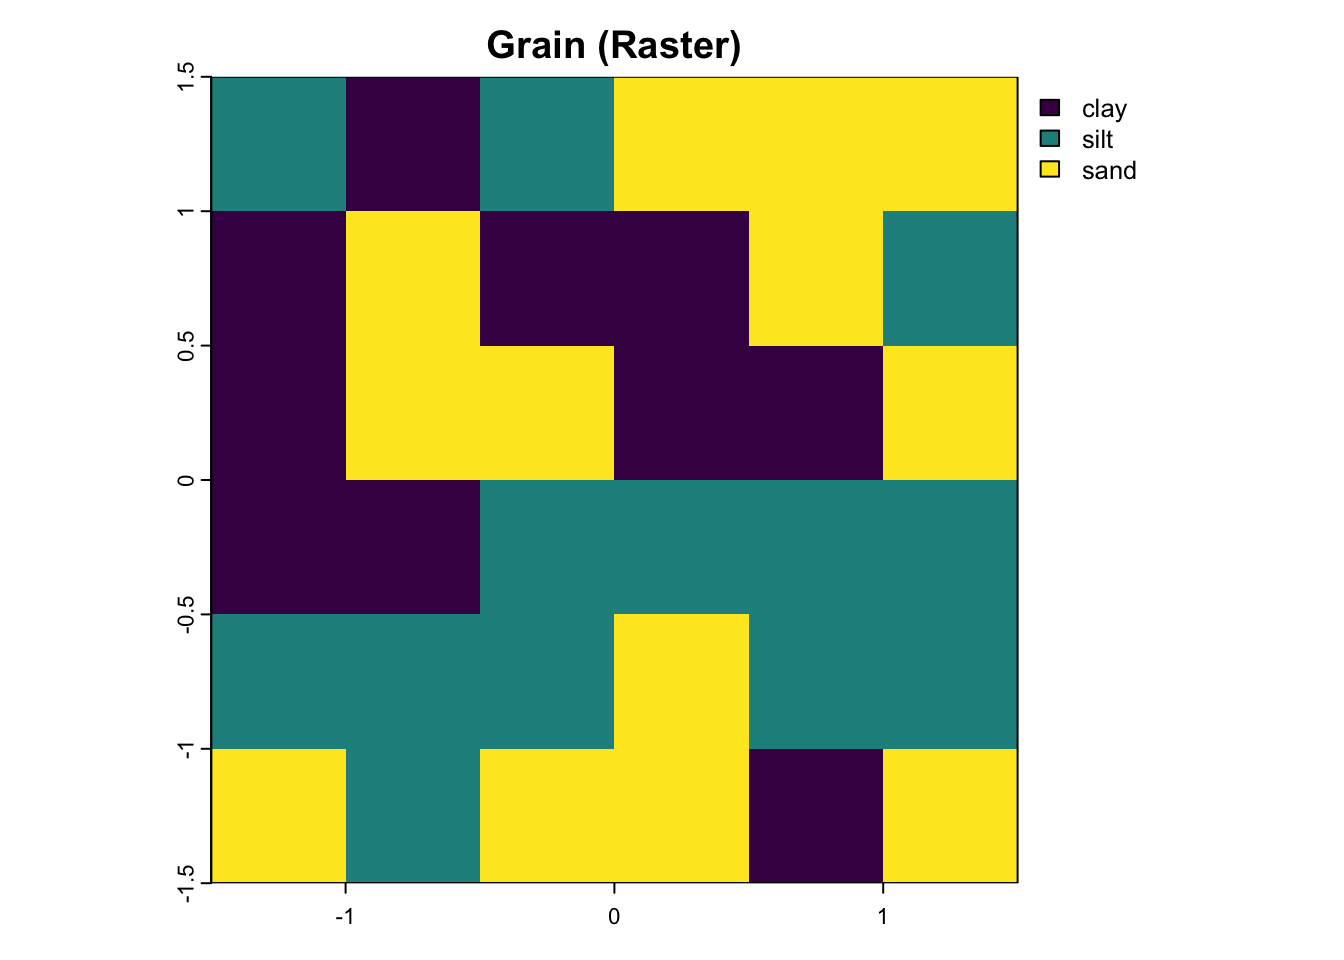
plot(grain_poly, main = "Grain (Vector)")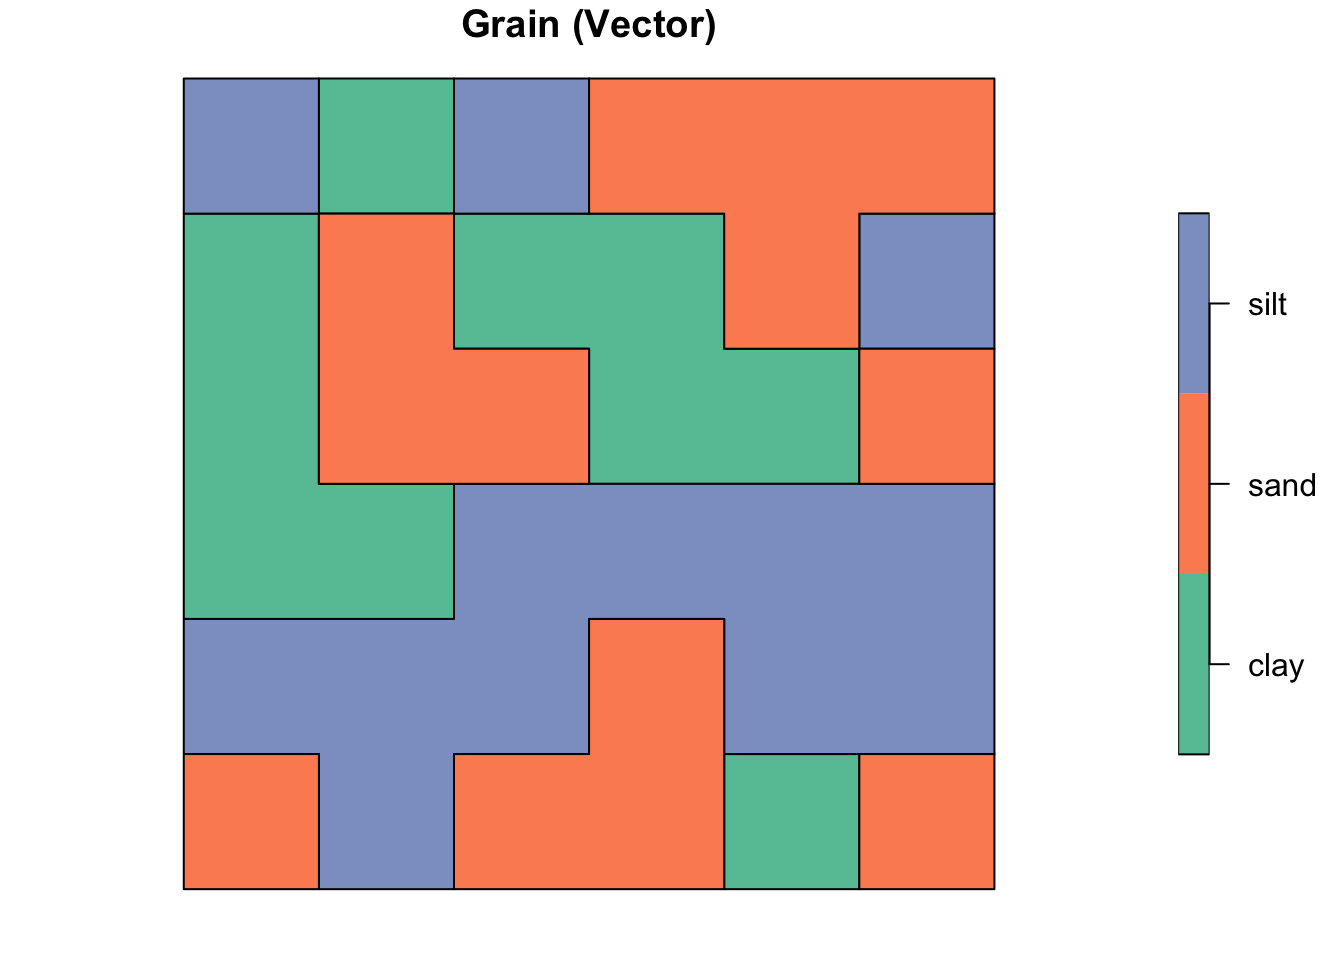
# Subset polygons to only clay
clay <- grain_poly %>%
  dplyr::filter(grain == "clay")

plot(clay, main = "Clay")