library(tidyverse)
library(spDataLarge)
library(sf)
library(stars)
library(terra)
NoteSource Materials
The following materials are modified from Geocomputation with R by Robin Lovelace. This page works through the same raster exercises twice: first with terra (Part 1), then with sf and stars (Part 2).
Get Started
- Create a version-controlled R Project
- Create a Quarto document
Let’s load all necessary packages:
You will be working with the following datasets:
- Digital elevation model (DEM) of Mt. Mongón, Perú, obtained from
spDataLarge - Landsat image of Zion National Park, obtained from
spDataLarge - SRTM elevation of Zion National Park, obtained from
spDataLarge
Exercises
- Explore elevation at Mt. Mongón, Perú
- Make a boxplot and histogram of elevation at Mt. Mongón, Perú
- Reclassify
demand compute the mean for the three classes:- Low, where elevation is less than 300
- Medium
- High, where elevation is greater than 500
- Explore NDVI and NDWI at Zion National Park
- Calculate the Normalized Difference Vegetation Index (NDVI) at Zion National Park
- Calculate the Normalized Difference Water Index (NDWI) at Zion National Park
- Find a correlation between NDVI and NDWI at Zion National Park
- Change resolution of elevation at Zion National Park
- Use all the methods available to change the resolution of elevation at Zion National Park to 0.01 by 0.01 degrees
- Note: The
srtmraster has a resolution of 0.00083 by 0.00083 degrees
- Note: The
- Use all the methods available to change the resolution of elevation at Zion National Park to 0.01 by 0.01 degrees
Landsat 8 bands 2-5 correspond to bands 1-4 for this raster. Bands are as follows:
| Band | Color | |
|---|---|---|
| 1 | blue | 30 meter |
| 2 | green | 30 meter |
| 3 | red | 30 meter |
| 4 | near-infrared | 30 meter |
NoteApply a scale factor and offset for all grid cells
Landsat Level-2 products are written as scaled integers to allow us to convert the data from floating point to integer for delivery. In most cases these are written to a 16-bit integer, which saves disk space and provides faster download times. Each floating point pixel has an offset applied and then multiplied by a gain to bring the value into the 16-bit integer (or unsigned integer) range. These values are referred to as scaled integers. To allow the user to get the data back to its original floating point value, a scale factor and offset are provided for each band.
| Science product | Scale factor | Offset |
|---|---|---|
| Surface reflectance | 0.0000275 | -0.2 |
First, correct the scale across all grid cells and then apply the following functions at each grid cell, in the image:
\[\text{NDWI} = \frac{\text{(green - NIR)}}{\text{(green + NIR)}}\] \[\text{NDVI} = \frac{\text{(NIR - red)}}{\text{(NIR + red)}}\]
Important
Both parts use the same object names (dem, landsat, srtm, …). Part 2 re-reads the data as stars objects, so it overwrites the terra objects from Part 1. Run the chunks in order.
Part 1: terra
1. Load the data
dem <- terra::rast(system.file("raster/dem.tif", package = "spDataLarge"))
landsat <- terra::rast(system.file("raster/landsat.tif", package = "spDataLarge"))
srtm <- terra::rast(system.file("raster/srtm.tif", package = "spDataLarge"))
2. Explore elevation at Mt. Mongón, Perú
TipSolution
# Use terra:: so R doesn't fall back to base hist()/boxplot(), which can't read a SpatRaster
terra::hist(dem,
            main = "Digital Elevation Model Distribution",
            xlab = "Value")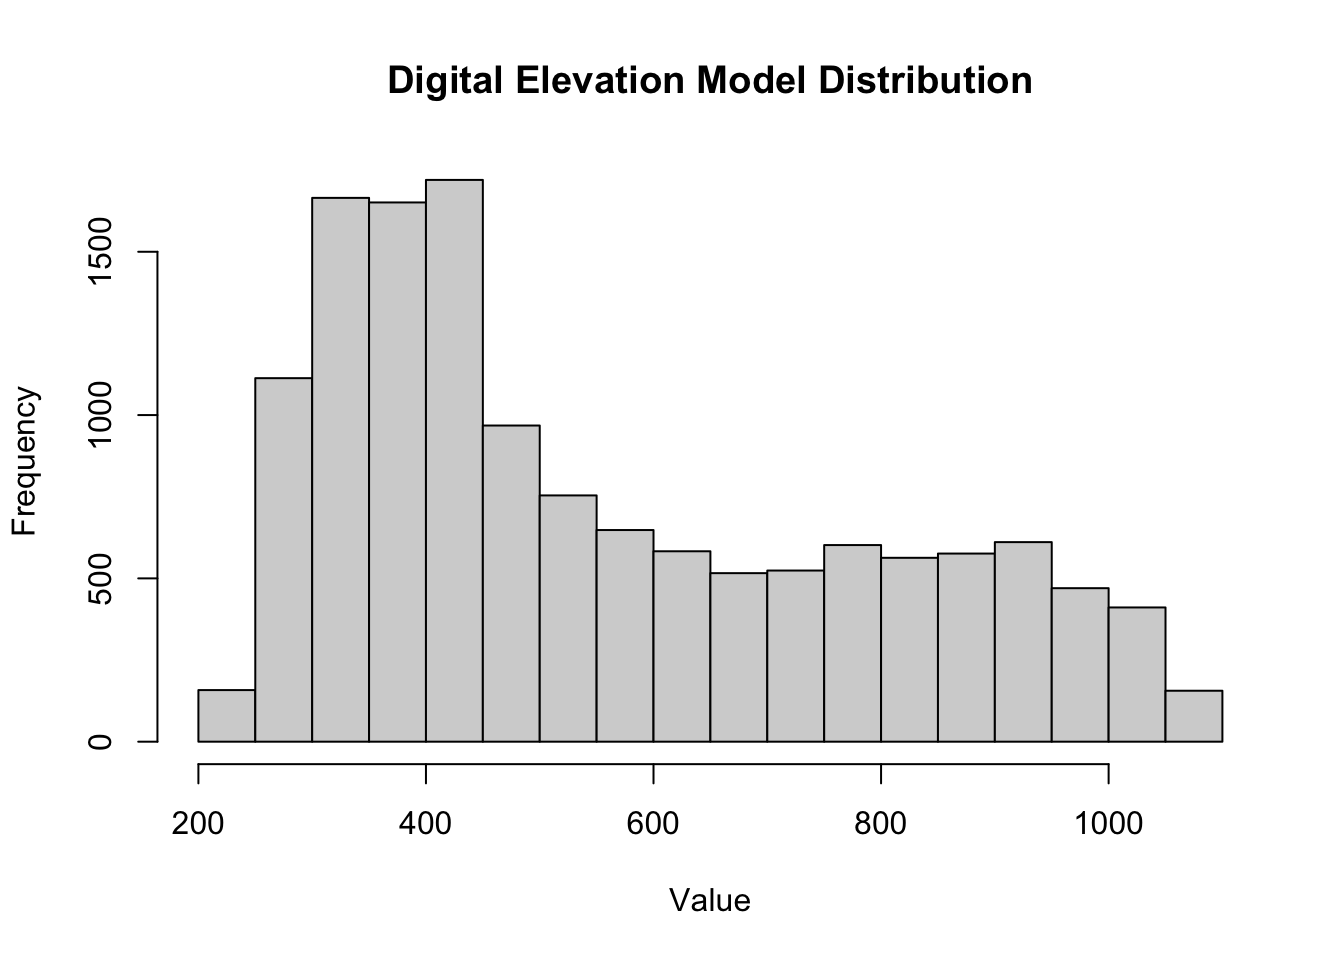
terra::boxplot(dem,
               main = "Digital Elevation Model Distribution",
               ylab = "Value")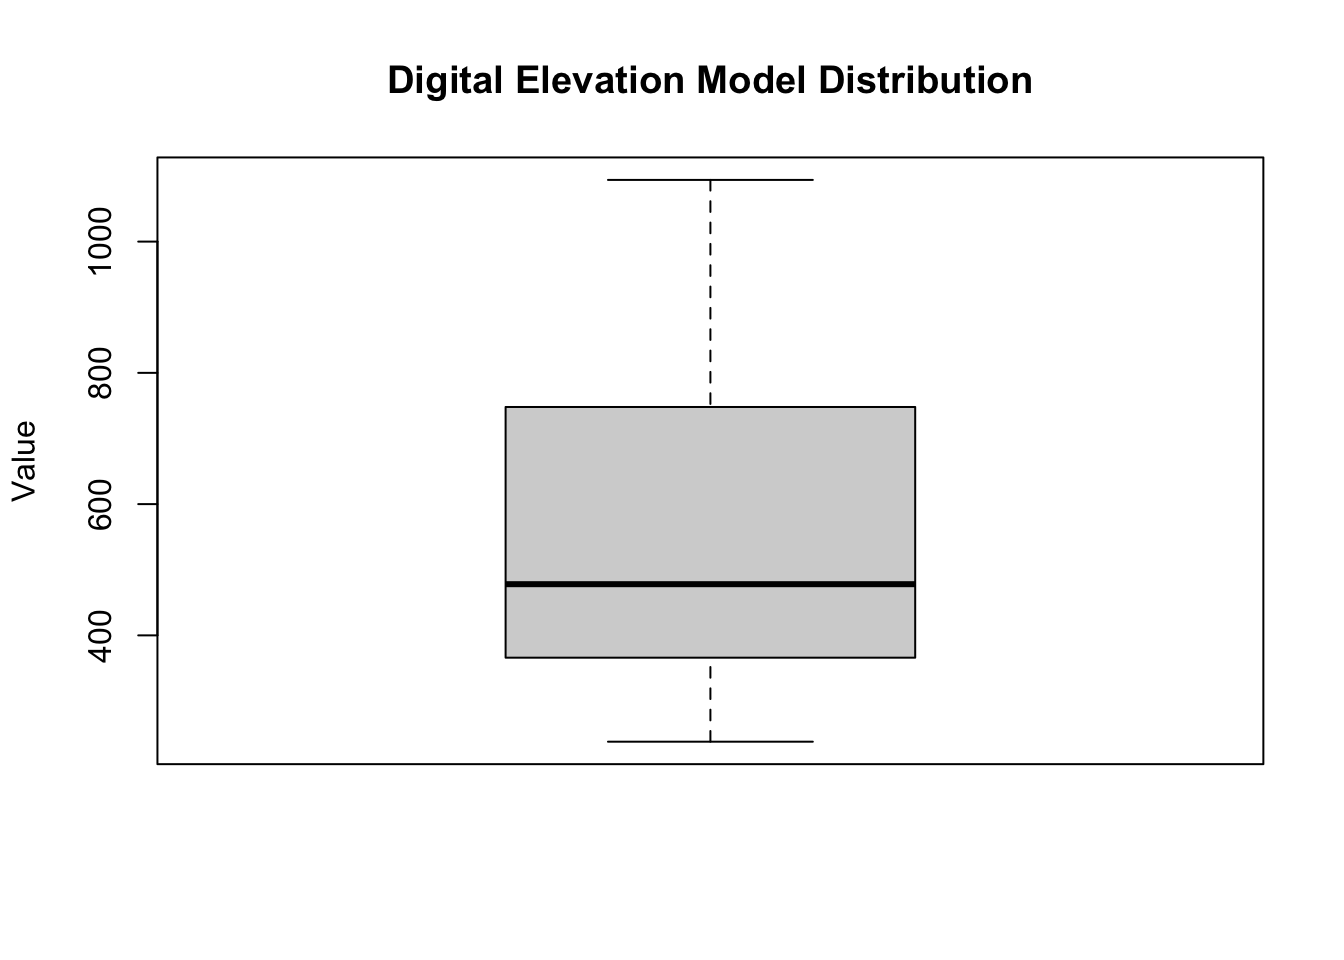
TipSolution
# Define a reclassification matrix
rcl <- matrix(c(-Inf, 300, 0, # values -Inf to 300 = 0
                300, 500, 1,  # values 300 to 500 = 1
                500, Inf, 2), # values 500 to Inf = 2
              ncol = 3, byrow = TRUE)

# Apply the matrix to reclassify the raster, making all cells 0 or 1 or 2
dem_rcl <- terra::classify(dem, rcl = rcl)

# Assign labels to the numerical categories

# Old version: works with newer terra, but older versions (e.g., 1.7) error with
# "[set.cats] the first column of 'value' must be numeric" because they don't accept a tibble
# levels(dem_rcl) <- tibble::tibble(id = 0:2,
#                                   cats = c("low", "medium", "high"))

# New version: a plain data.frame works with both older and newer terra
levels(dem_rcl) <- data.frame(id = 0:2,
                              cats = c("low", "medium", "high"))

# Calculate mean elevation for each category using original DEM values
elevation_mean <- terra::zonal(dem, dem_rcl, fun = "mean")
elevation_mean
cats dem
1 low 274.3910
2 medium 392.0486
3 high 765.21973. Explore NDVI and NDWI at Zion National Park
- Hint: Explore the
terrapackage to find a function that can help find the correlation!
TipSolution
scale_factor <- 0.0000275
offset <- 0.2

scale_function <- function(x) {
  x * scale_factor + offset
}

landsat_scaled <- terra::app(landsat, fun = scale_function)
TipSolution
ndwi_fun <- function(green, nir){
    (green - nir)/(green + nir)
}

ndvi_fun <- function(nir, red){
  (nir - red)/(nir + red)
}
TipSolution
ndwi_rast <- terra::lapp(landsat_scaled[[c(2, 4)]],
                         fun = ndwi_fun)

ndvi_rast <- terra::lapp(landsat_scaled[[c(4, 3)]],
fun = ndvi_fun)plot(ndwi_rast,
main = "Zion National Park NDWI")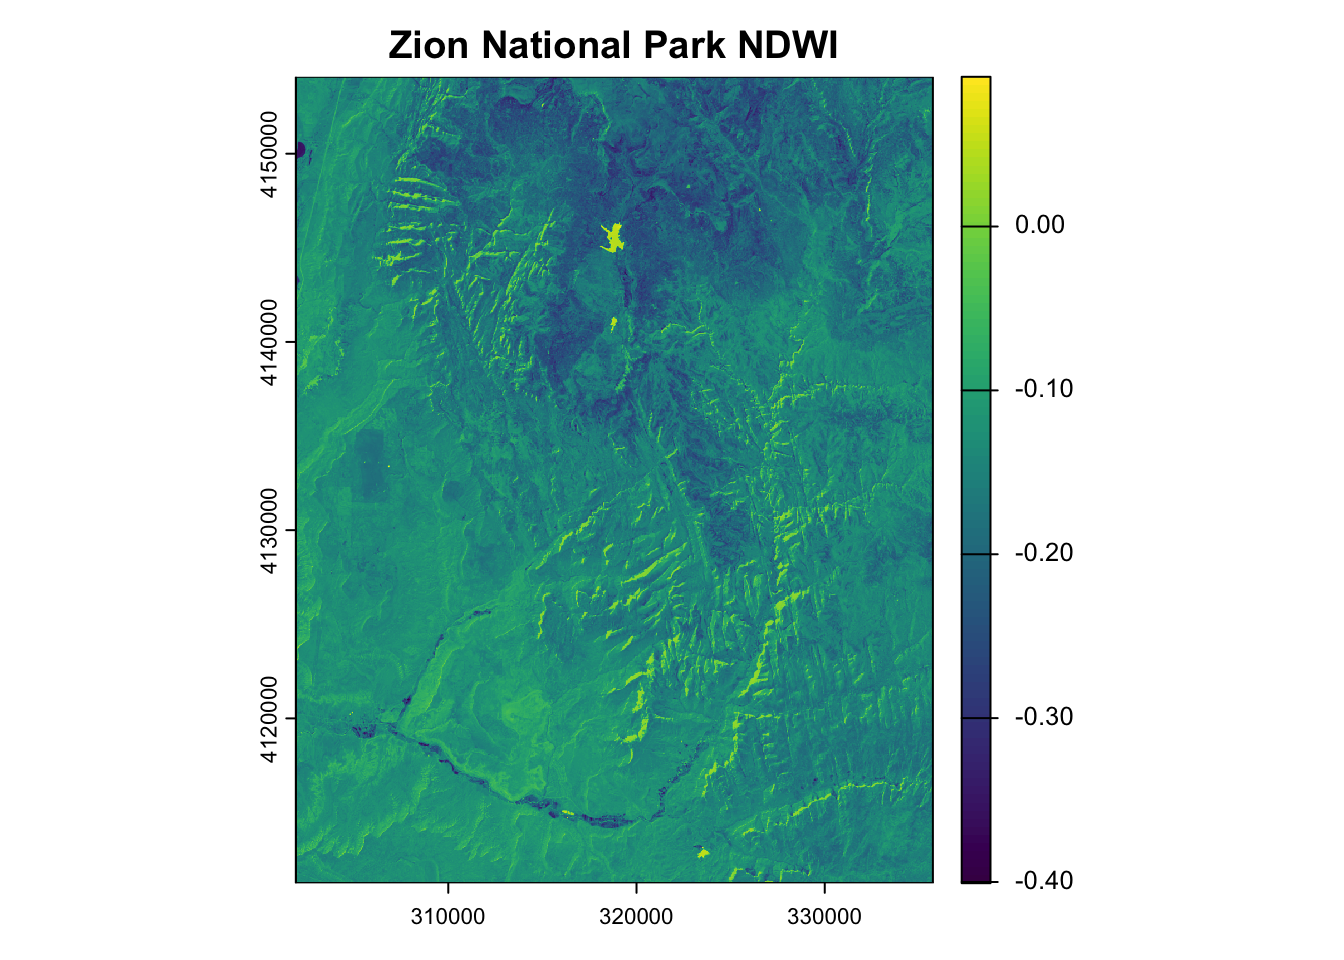
library(terra)combine <- c(ndvi_rast, ndwi_rast) # Stack rasters
plot(combine, main = c("NDVI", "NDWI")) # Plot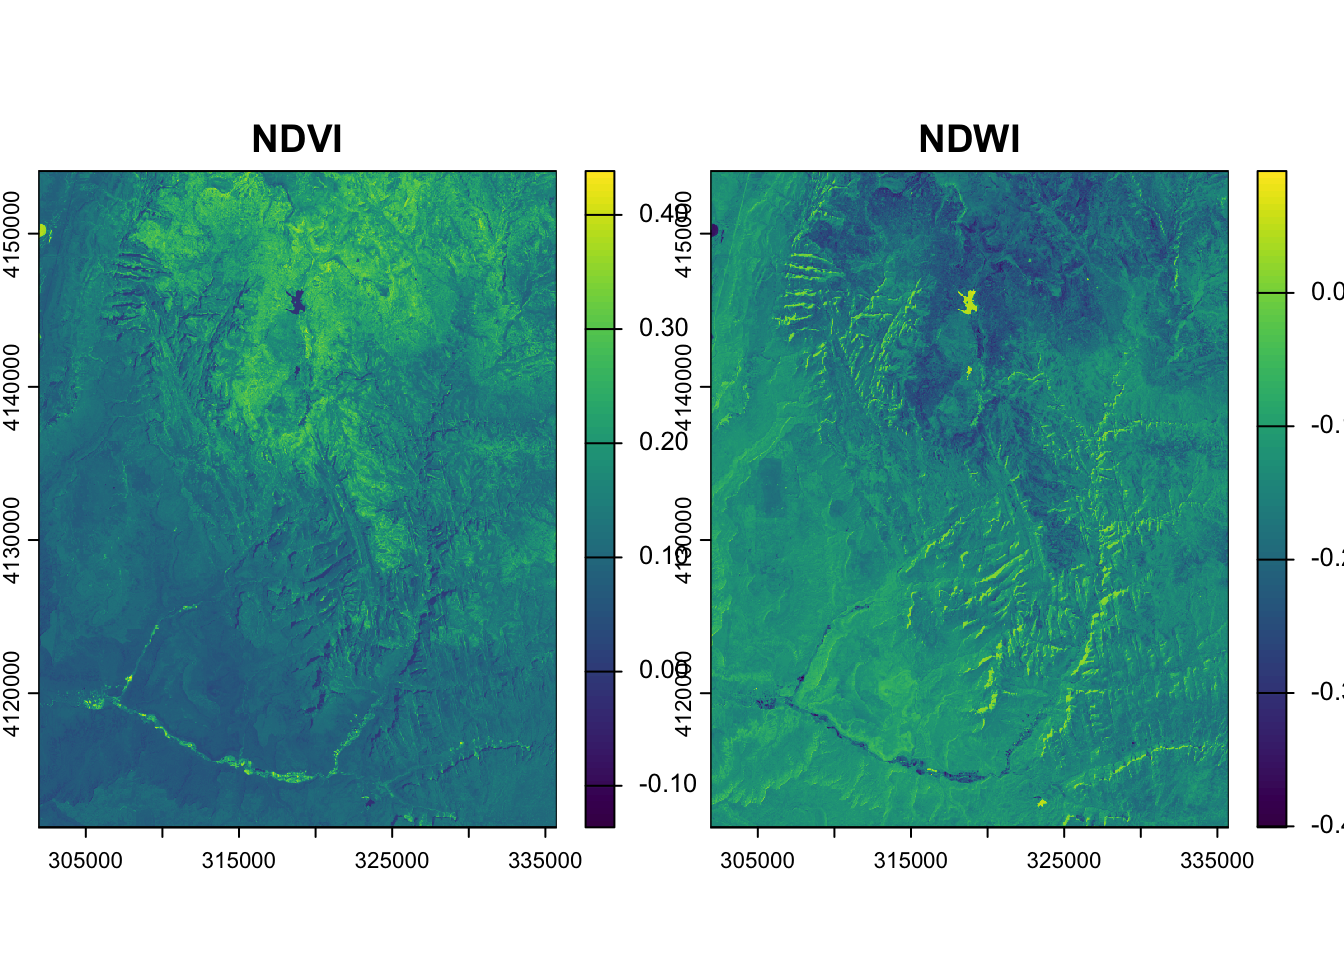
# Calculate correlation between raster layers
terra::layerCor(combine, fun = cor)
[,1] [,2]
[1,] 1.0000000 -0.9062336
[2,] -0.9062336 1.00000004. Change resolution of elevation at Zion National Park
TipSolution
plot(srtm)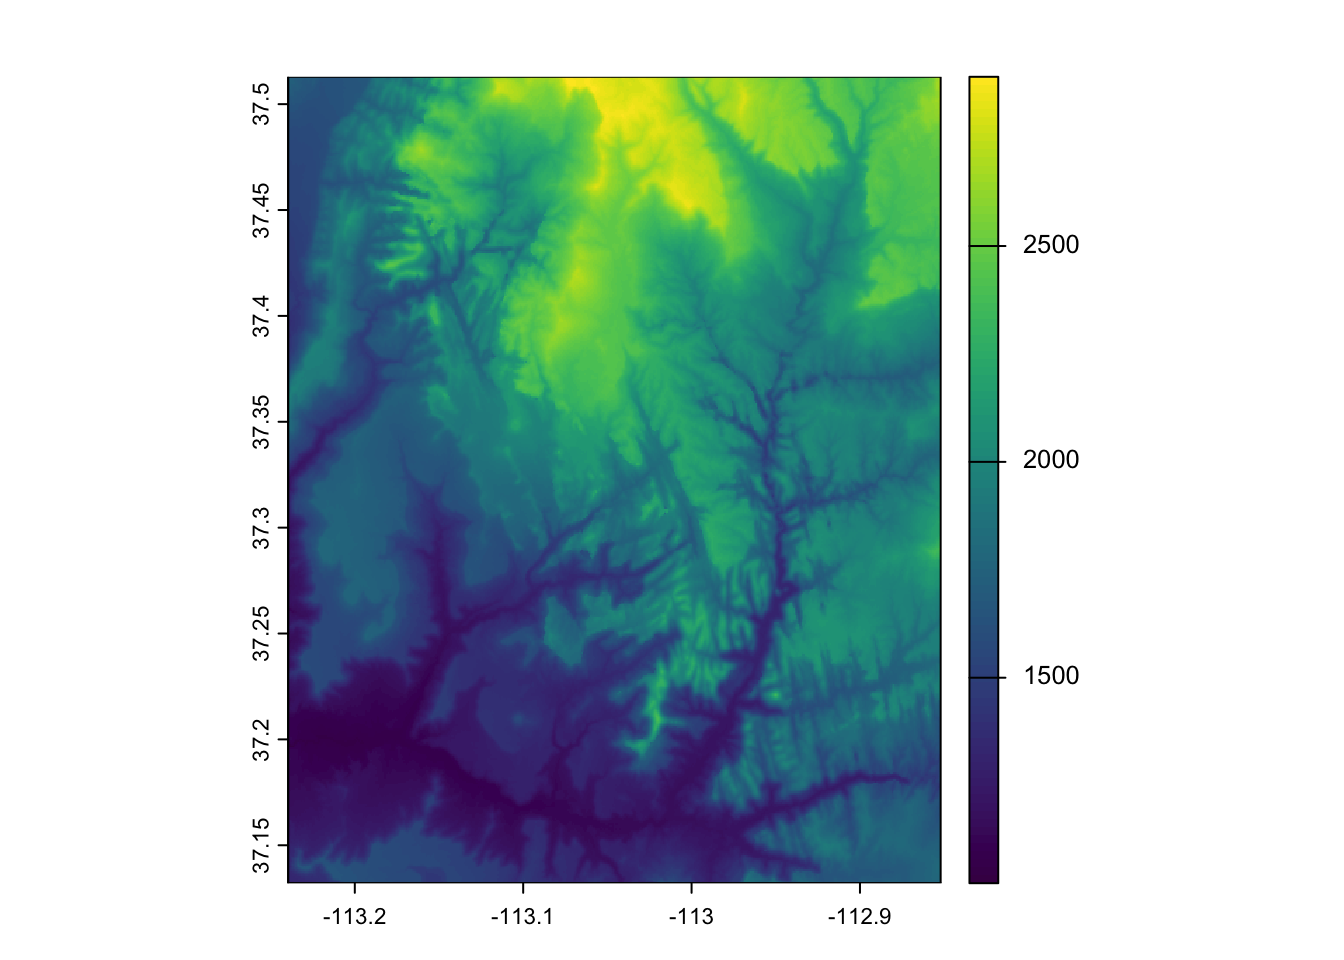
rast_template <- terra::rast(terra::ext(srtm), res = 0.01) # Create empty templatesrtm_resampl1 <- terra::resample(srtm, y = rast_template, method = "bilinear")
srtm_resampl2 <- terra::resample(srtm, y = rast_template, method = "near")
srtm_resampl3 <- terra::resample(srtm, y = rast_template, method = "cubic")
srtm_resampl4 <- terra::resample(srtm, y = rast_template, method = "cubicspline")
srtm_resampl5 <- terra::resample(srtm, y = rast_template, method = "lanczos")srtm_resampl_all <- c(srtm_resampl1, srtm_resampl2, srtm_resampl3, srtm_resampl4, srtm_resampl5)
labs <- c("Bilinear", "Near", "Cubic", "Cubic Spline", "Lanczos")
plot(srtm_resampl_all, main = labs)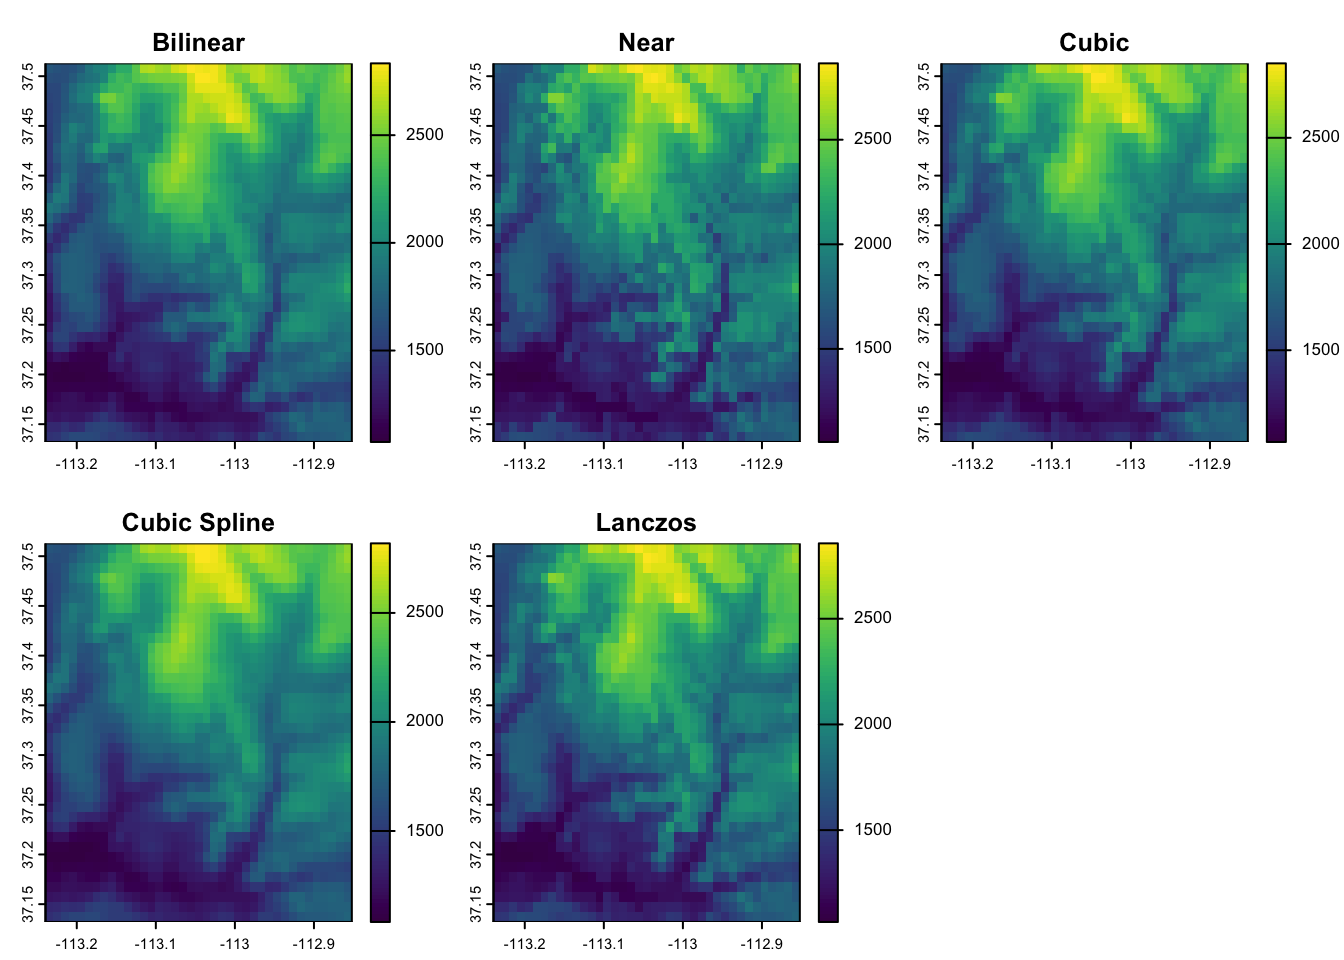
Part 2: sf + stars
1. Load the data
dem <- stars::read_stars(system.file("raster/dem.tif", package = "spDataLarge"))
landsat <- stars::read_stars(system.file("raster/landsat.tif", package = "spDataLarge"))
srtm <- stars::read_stars(system.file("raster/srtm.tif", package = "spDataLarge"))class(srtm) # should be "stars" in Part 2[1] "stars"# A stars object is a list of arrays (attributes) plus a set of dimensions
demstars object with 2 dimensions and 1 attribute
attribute(s):
Min. 1st Qu. Median Mean 3rd Qu. Max.
dem.tif 238 366 478 555.9741 748 1094
dimension(s):
from to offset delta refsys point x/y
x 1 117 794599 30.85 WGS 84 / UTM zone 17S FALSE [x]
y 1 117 8935384 -30.85 WGS 84 / UTM zone 17S FALSE [y]landsat # Note the third dimension, "band"stars object with 3 dimensions and 1 attribute
attribute(s), summary of first 1e+05 cells:
Min. 1st Qu. Median Mean 3rd Qu. Max.
landsat.tif 7701 8412 8739 8941.313 9258 14072
dimension(s):
from to offset delta refsys point x/y
x 1 1128 301905 30 WGS 84 / UTM zone 12N FALSE [x]
y 1 1428 4154085 -30 WGS 84 / UTM zone 12N FALSE [y]
band 1 4 NA NA NA NA 2. Explore elevation at Mt. Mongón, Perú
TipSolution
# Extract the array of values from the first (and only) attribute
dem_values <- as.vector(dem[[1]])

hist(dem_values,
     main = "Digital Elevation Model Distribution",
     xlab = "Value")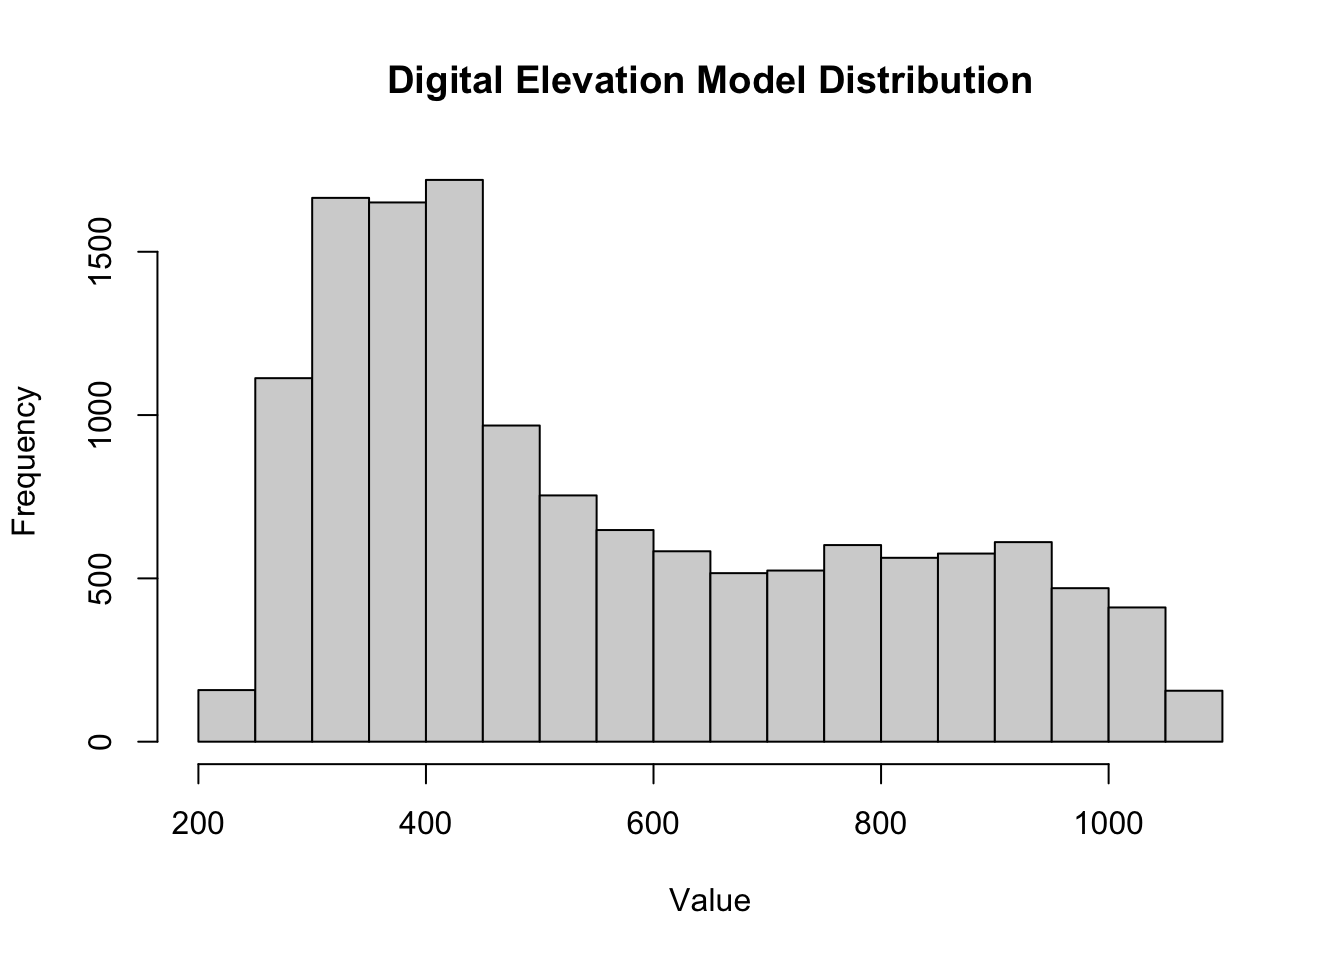
boxplot(dem_values,
        main = "Digital Elevation Model Distribution",
        ylab = "Value")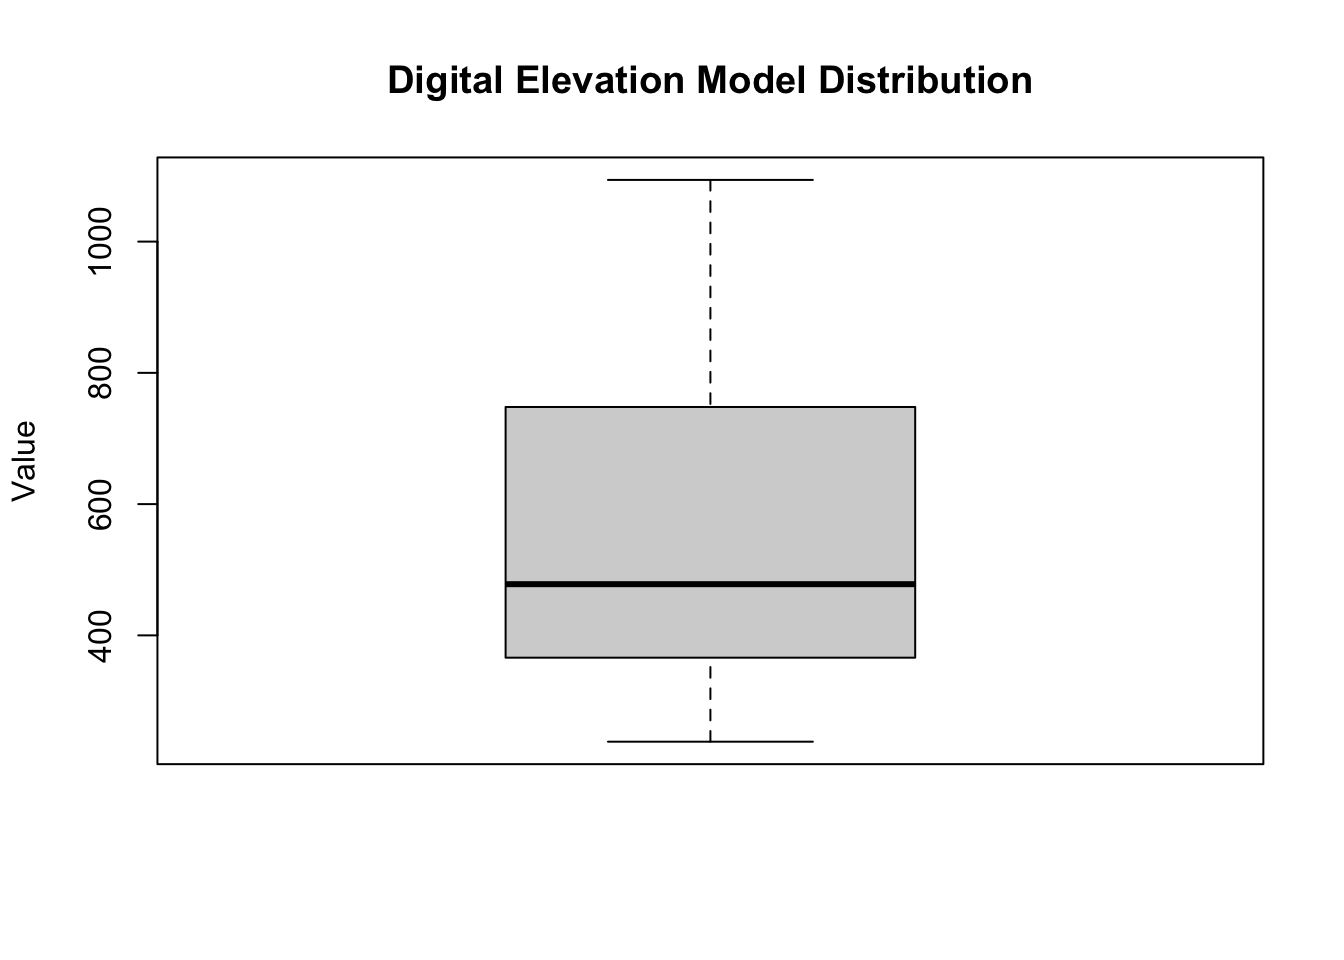
TipSolution
# Reclassify by cutting values into intervals, returning a factor raster
dem_rcl <- cut(dem,
               breaks = c(-Inf, 300, 500, Inf), # -Inf to 300, 300 to 500, 500 to Inf
               labels = c("low", "medium", "high"))

plot(dem_rcl, main = "Reclassified elevation")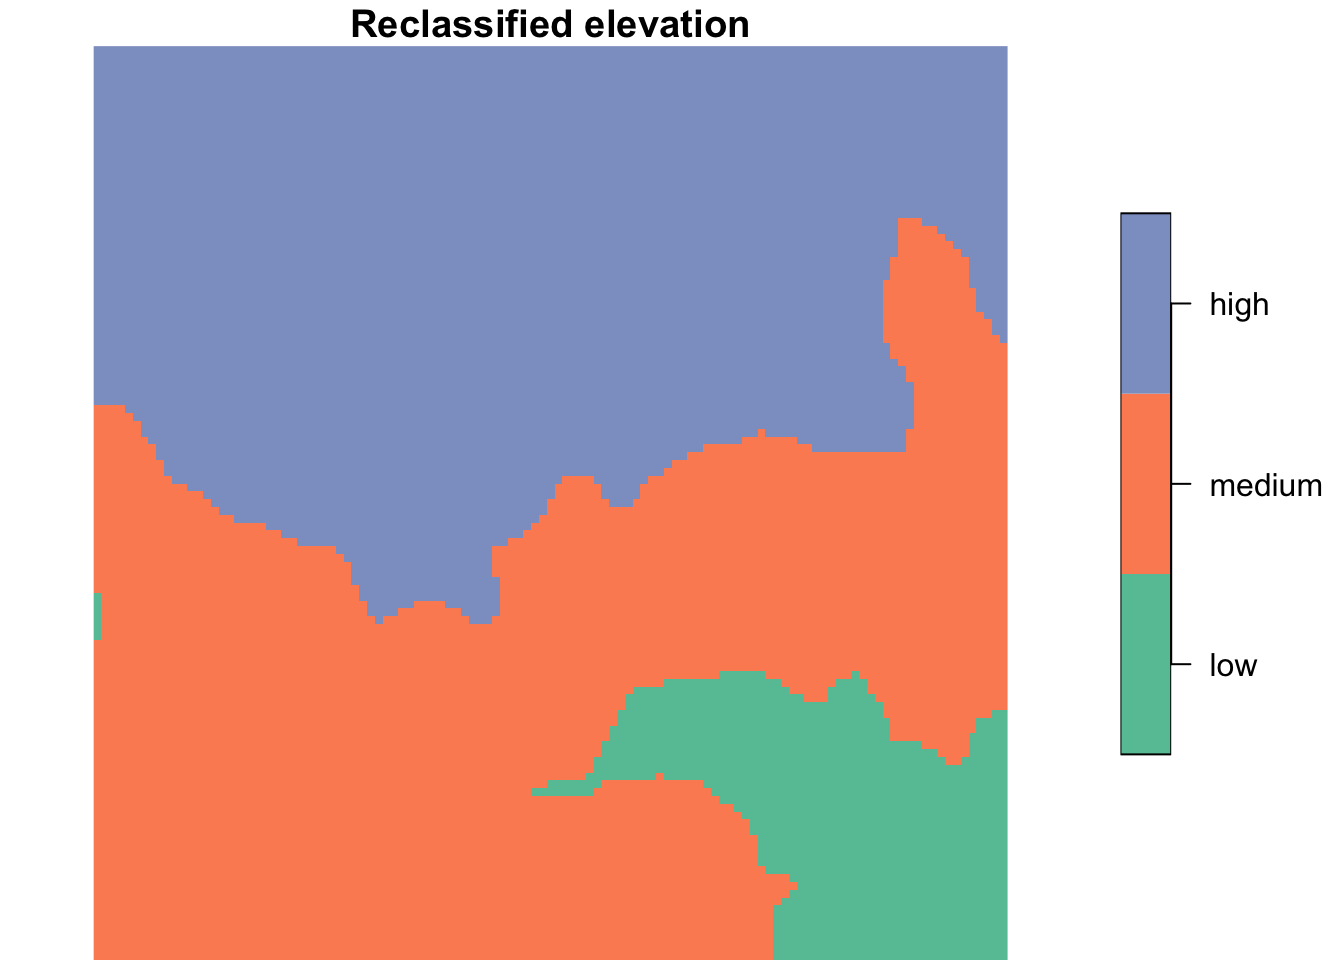
# Calculate mean elevation for each category using original DEM values
elevation_mean <- tibble(elevation = as.vector(dem[[1]]),
                         cats = factor(as.vector(dem_rcl[[1]]), levels = levels(dem_rcl[[1]]))) %>%
  group_by(cats) %>%
  summarise(mean_elevation = mean(elevation, na.rm = TRUE))
elevation_mean
# A tibble: 3 × 2
cats mean_elevation
<fct> <dbl>
1 low 274.
2 medium 392.
3 high 765.Alternatively, we can use sf to turn the classes into polygons and then aggregate the original raster over those polygons:
# Polygonize the reclassified raster, merging cells of the same class
dem_polys <- sf::st_as_sf(dem_rcl, merge = TRUE) %>%
  group_by(dem.tif) %>%
  summarise() # Dissolve into one (multi)polygon per class

# Compute the mean of DEM values falling inside each polygon
aggregate(dem, by = dem_polys, FUN = mean) %>%
  sf::st_as_sf() %>%
  mutate(cats = dem_polys$dem.tif)
Simple feature collection with 3 features and 2 fields
Geometry type: GEOMETRY
Dimension: XY
Bounding box: xmin: 794599.1 ymin: 8931775 xmax: 798208.6 ymax: 8935384
Projected CRS: WGS 84 / UTM zone 17S
dem.tif geometry cats
1 274.3910 MULTIPOLYGON (((797252.2 89... low
2 392.0486 POLYGON ((797776.7 8934706,... medium
3 765.2197 POLYGON ((794599.1 8935384,... high3. Explore NDVI and NDWI at Zion National Park
- Hint: A
starsattribute is just an R array, so base R functions work on it!
TipSolution
scale_factor <- 0.0000275
offset <- 0.2

# Arithmetic on a stars object is applied to every grid cell
landsat_scaled <- landsat * scale_factor + offset
TipSolution
ndwi_fun <- function(green, nir){
    (green - nir)/(green + nir)
}

ndvi_fun <- function(nir, red){
  (nir - red)/(nir + red)
}
TipSolution
# Split the "band" dimension into attributes (X1 = blue, X2 = green, X3 = red, X4 = NIR)
landsat_bands <- split(landsat_scaled, "band")
landsat_bands
stars object with 2 dimensions and 4 attributes
attribute(s), summary of first 1e+05 cells:
Min. 1st Qu. Median Mean 3rd Qu. Max.
X1 0.4117775 0.431330 0.4403225 0.4458861 0.4545950 0.5869800
X2 0.3808675 0.424235 0.4372150 0.4434250 0.4559700 0.6300725
X3 0.3624975 0.408395 0.4303675 0.4419199 0.4632575 0.7378725
X4 0.3555675 0.618495 0.6523750 0.6498339 0.6853750 0.9389525
dimension(s):
from to offset delta refsys point x/y
x 1 1128 301905 30 WGS 84 / UTM zone 12N FALSE [x]
y 1 1428 4154085 -30 WGS 84 / UTM zone 12N FALSE [y]ndwi_rast <- landsat_bands %>%
transmute(ndwi = ndwi_fun(green = X2, nir = X4))
ndvi_rast <- landsat_bands %>%
transmute(ndvi = ndvi_fun(nir = X4, red = X3))plot(ndwi_rast,
main = "Zion National Park NDWI")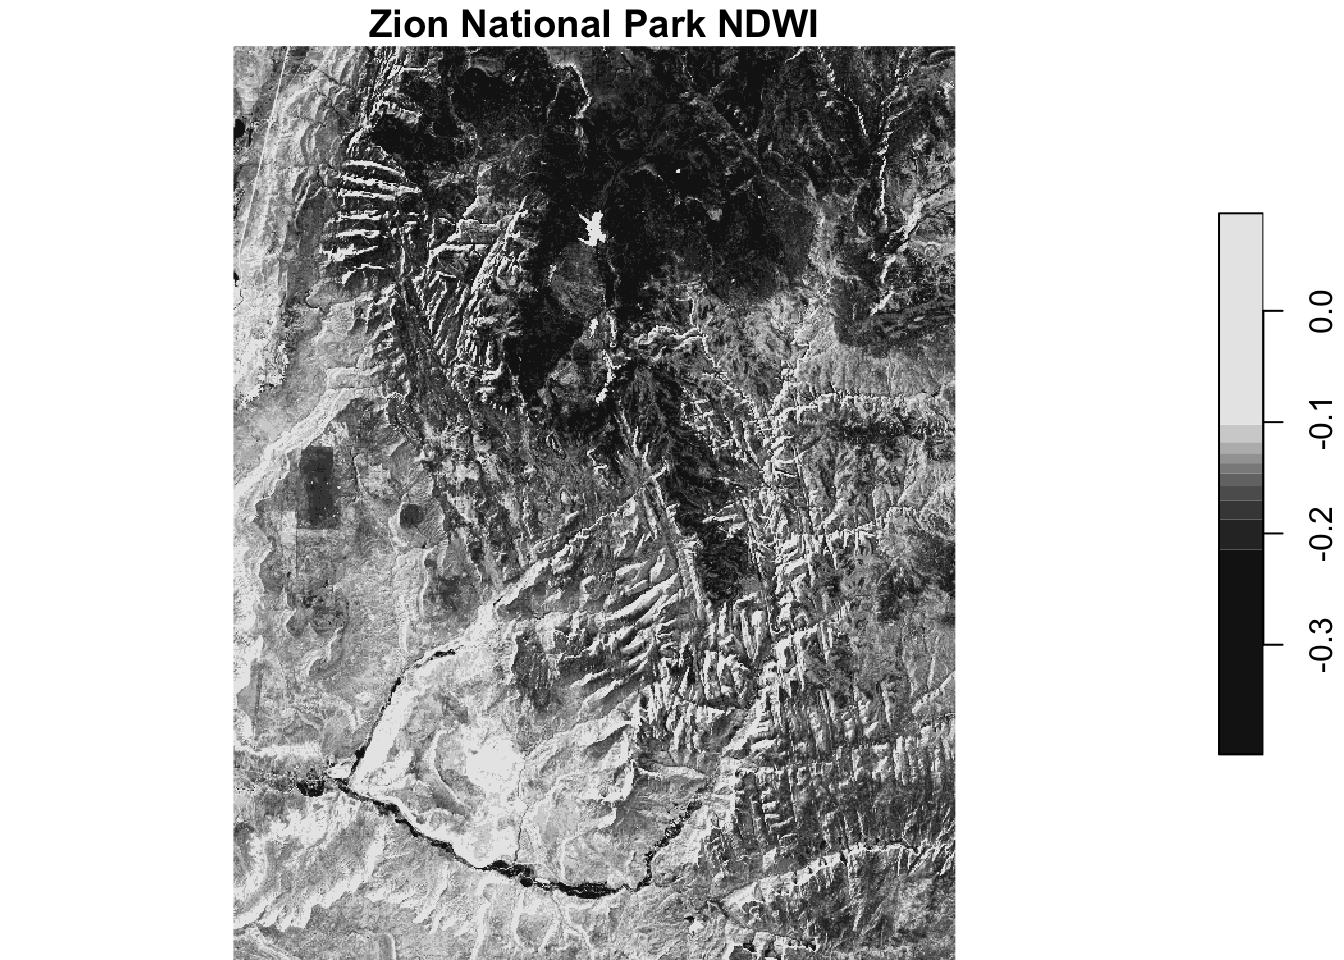
plot(ndvi_rast,
     main = "Zion National Park NDVI")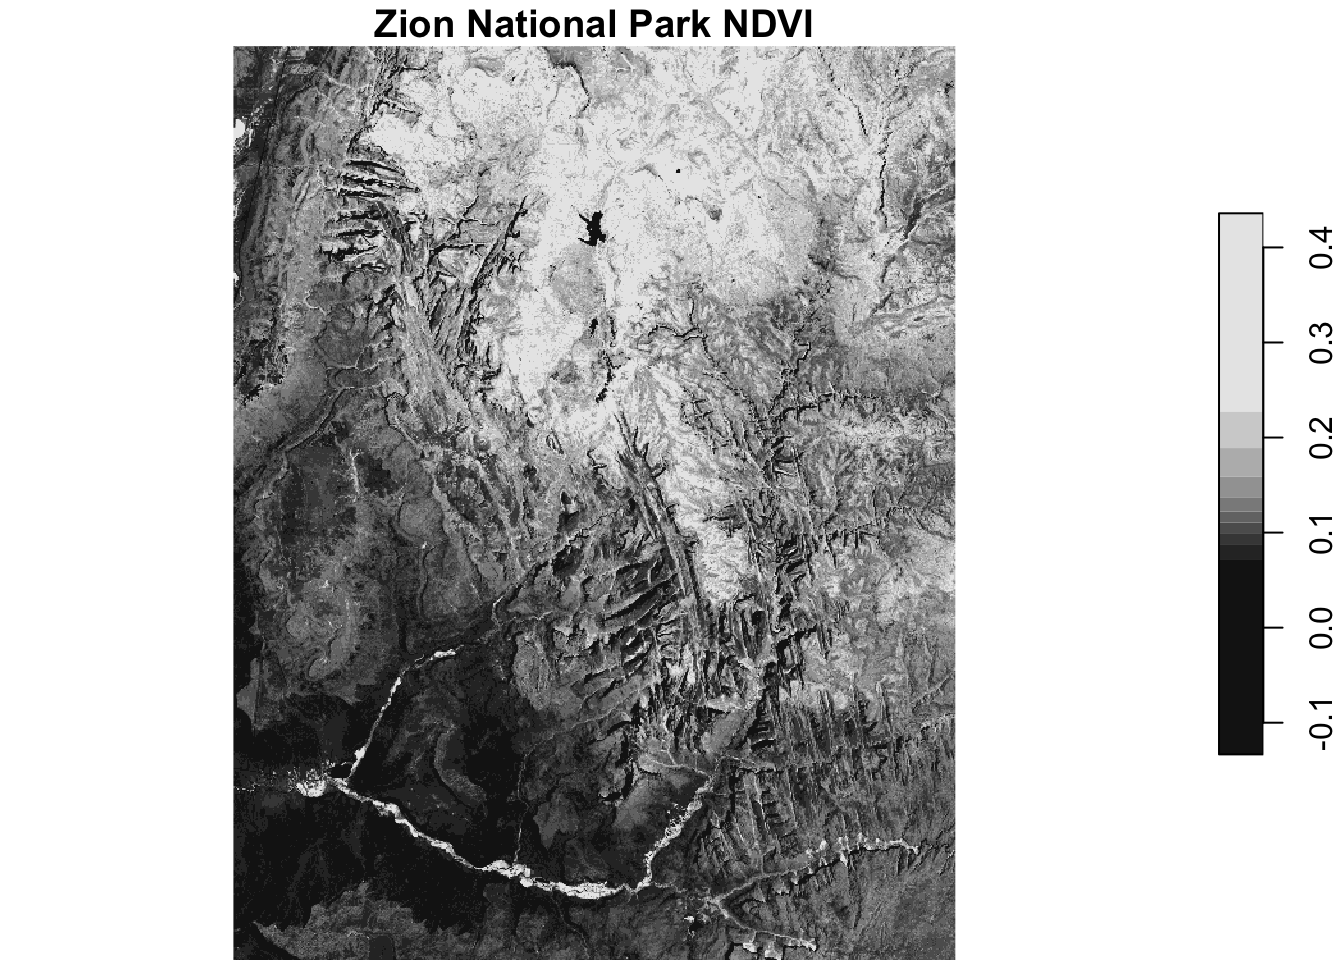
combine <- c(ndvi_rast, ndwi_rast) # Combine as two attributes

plot(merge(combine)) # Merge attributes into a dimension to plot side by side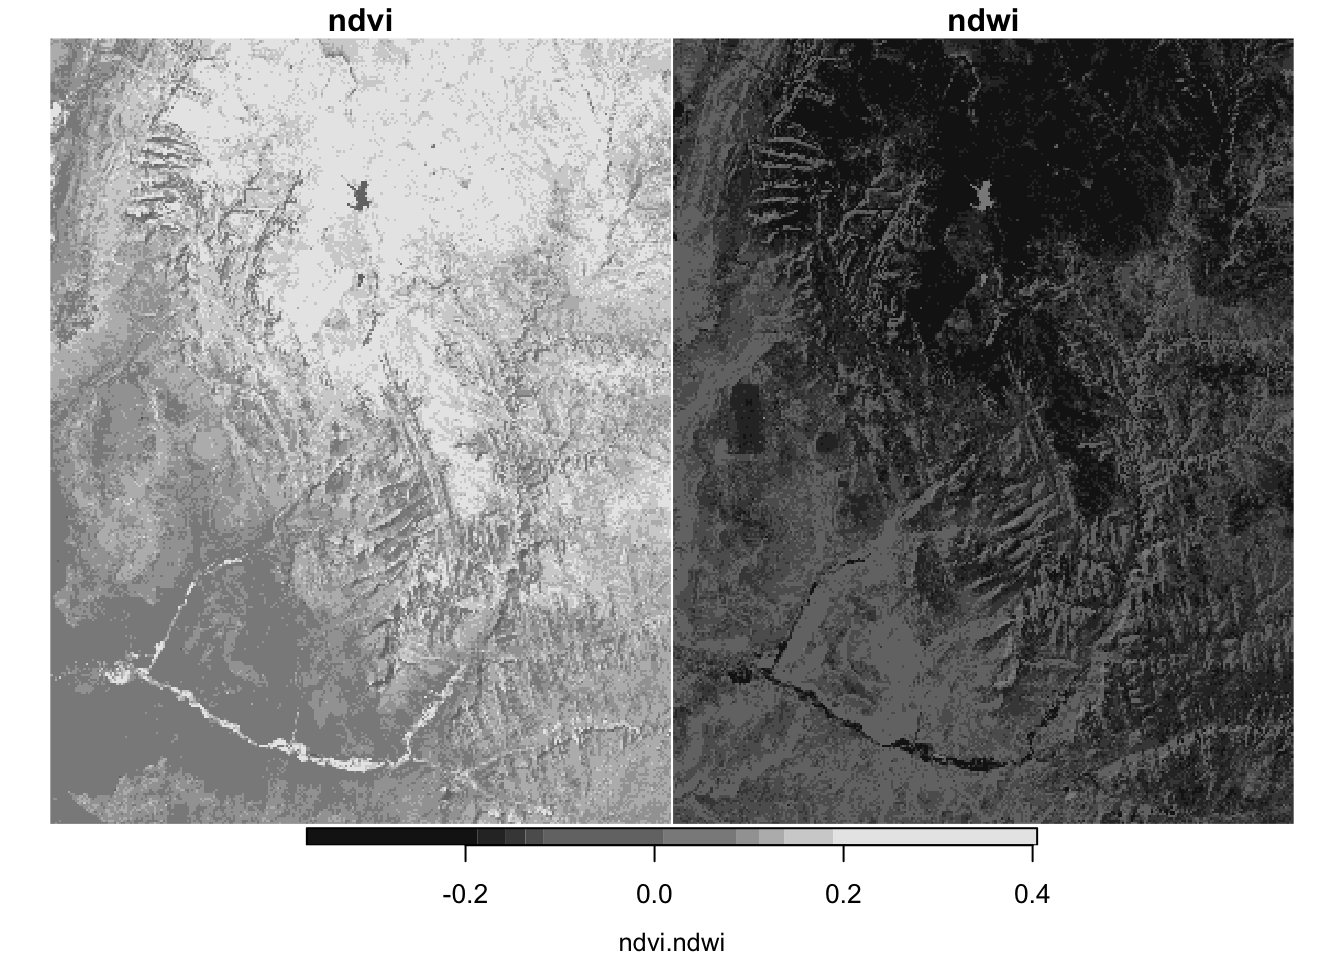
# Calculate correlation between the two attributes
cor(as.vector(combine$ndvi), as.vector(combine$ndwi), use = "complete.obs")
[1] -0.90623364. Change resolution of elevation at Zion National Park
TipSolution
plot(srtm)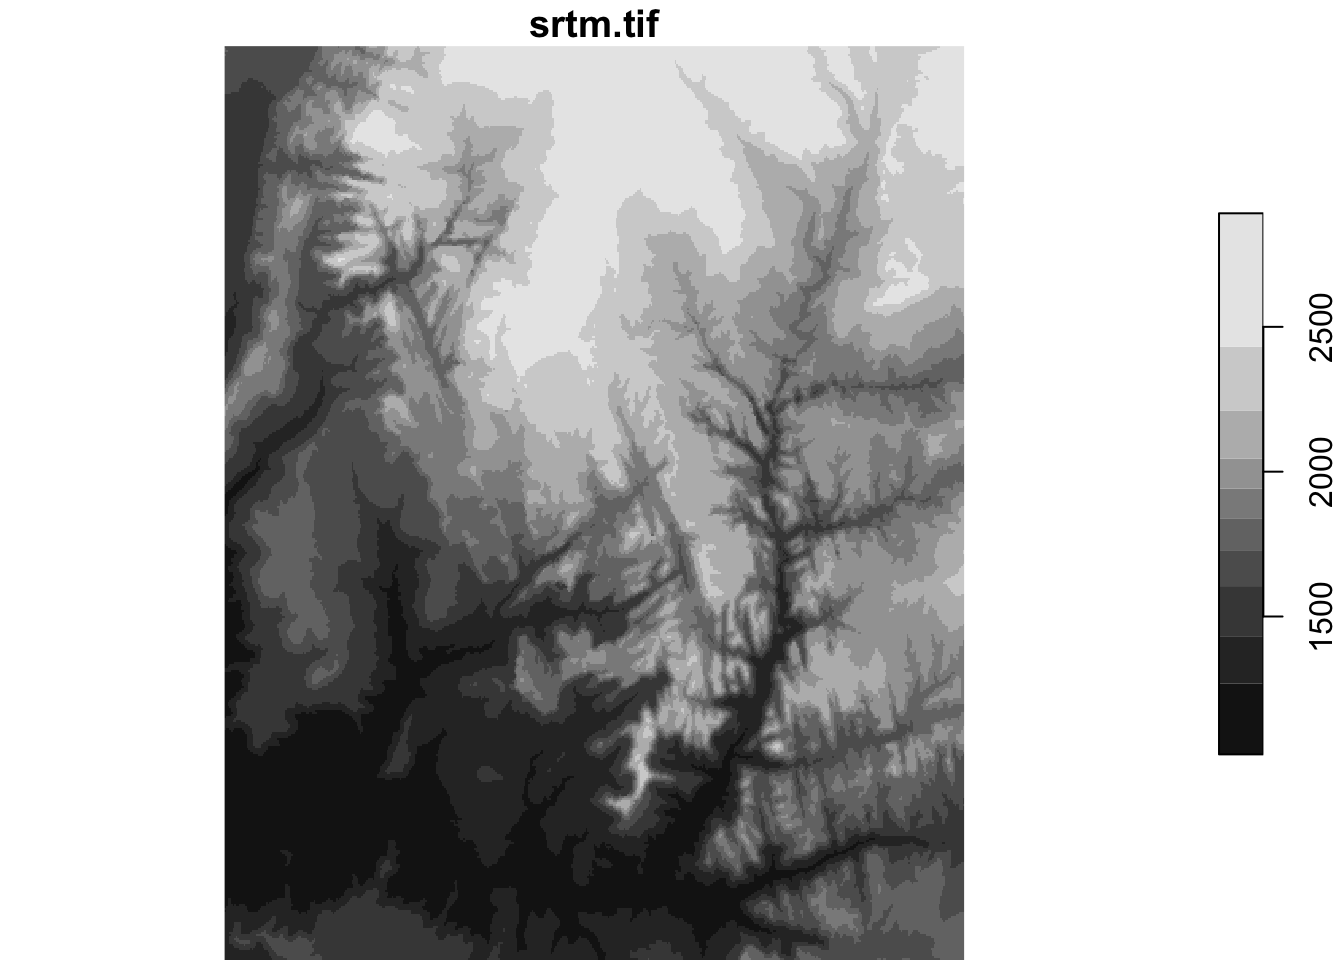
# Create empty template from the bounding box of srtm
rast_template <- stars::st_as_stars(sf::st_bbox(srtm), dx = 0.01, dy = 0.01)
# use_gdal = TRUE is needed for methods other than nearest neighbor
srtm_resampl1 <- stars::st_warp(srtm, dest = rast_template, method = "bilinear", use_gdal = TRUE, no_data_value = -9999)
srtm_resampl2 <- stars::st_warp(srtm, dest = rast_template, method = "near", use_gdal = TRUE, no_data_value = -9999)
srtm_resampl3 <- stars::st_warp(srtm, dest = rast_template, method = "cubic", use_gdal = TRUE, no_data_value = -9999)
srtm_resampl4 <- stars::st_warp(srtm, dest = rast_template, method = "cubicspline", use_gdal = TRUE, no_data_value = -9999)
srtm_resampl5 <- stars::st_warp(srtm, dest = rast_template, method = "lanczos", use_gdal = TRUE, no_data_value = -9999)srtm_resampl_all <- c(srtm_resampl1, srtm_resampl2, srtm_resampl3, srtm_resampl4, srtm_resampl5)
names(srtm_resampl_all) <- c("Bilinear", "Near", "Cubic", "Cubic Spline", "Lanczos")
plot(merge(srtm_resampl_all))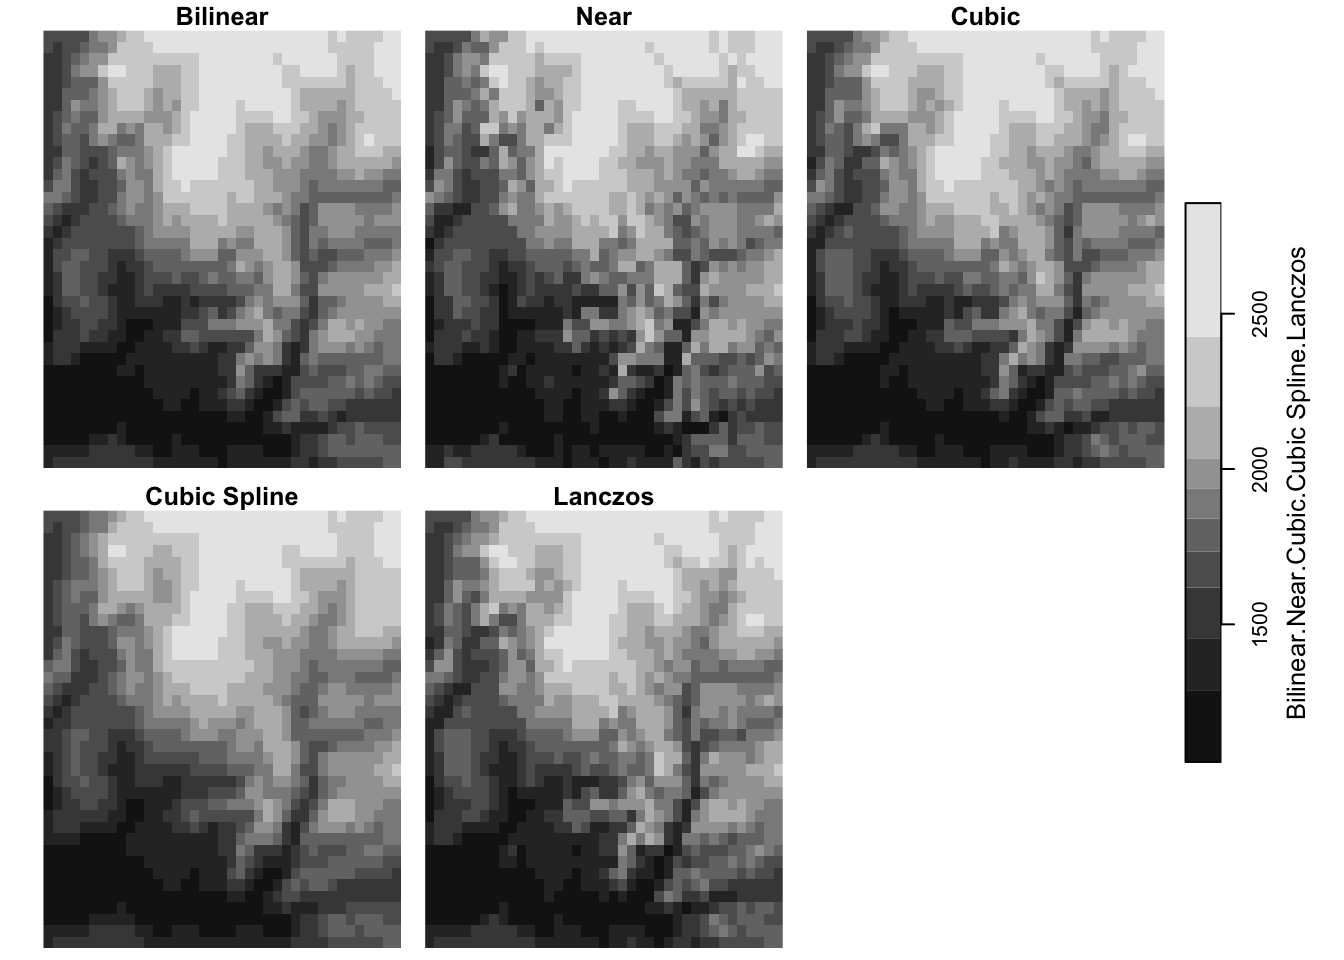
terra vs. stars: what’s the difference?
NoteSource
The written comparison below is based on Chapter 7: Introduction to sf and stars in Spatial Data Science: With Applications in R by Edzer Pebesma and Roger Bivand.
Both packages gave the same answers above (identical class means and an NDVI–NDWI correlation of about -0.91). The difference is in how each package represents raster data.
terra (successor of raster)
raster, and now its successorterra, has long been the main R package for powerful, flexible, and scalable raster analysis.- Its data model is a 2D regular raster, or a set (stack) of raster layers. This fits a static “GIS view” of the world, where each theme is a layer.
- For data that change over time, a layer stack means the user has to keep track of which layer represents what (e.g., which layer is which date or band).
stars (spatiotemporal arrays)
starswas written to support raster and vector data cubes. Raster layers, raster stacks, and feature time series are special cases of a data cube.- A
starsobject is a list of arrays (attributes) plus a table of dimensions (x, y, band, time, …) with fields likeoffset,delta, andrefsys. Time is just another dimension, so time-varying raster stacks are represented directly. - It handles regular grids as well as rotated, sheared, rectilinear, and curvilinear rasters, and arrays whose spatial dimension is a set of geometries (vector data cubes).
- It is tightly integrated with
sf: functions share thest_prefix, rasters can be cropped or aggregated withsfobjects, andst_as_sf()converts back tosf. - It follows tidyverse design:
filter(),slice(),mutate(), andtransmute()work on data cubes. - It aims to scale beyond local disk size;
stars_proxyobjects are essentially pointers to files that are only read when needed.
terra |
stars |
|
|---|---|---|
| Data model | 2D regular raster or a stack of layers | N-dimensional arrays (data cubes) with attributes and dimensions |
| Time-varying data | User keeps track of which layer is which | Time is a dimension of the cube |
| Grid types | Regular rasters | Regular, rotated, sheared, rectilinear, curvilinear, and vector data cubes |
| Scale | Handles data up to the size of local storage | Aims beyond local disk size using stars_proxy objects |
How this showed up in this lab
| Task | terra (Part 1) |
stars (Part 2) |
|---|---|---|
| Multi-band data | Each band is a layer: landsat_scaled[[c(4, 3)]] |
Bands are a dimension; split() turns them into attributes (X1–X4) and merge() reverses it |
| Cell-wise math | app(), lapp() |
Arithmetic is passed on to the arrays: landsat * scale_factor + offset, transmute() |
| Reclassify and zonal statistics | classify() + zonal() |
cut(), then st_as_sf() + aggregate() with polygons |
| Resampling | resample() to a template |
st_warp() to a target grid; the book recommends giving the target grid as a stars object, as we did with rast_template |