Important
You must earn a “Satisfactory” on all parts of the assignment to earn a “Satisfactory” on the assignment.
The assignment must be submitted through Gradescope.
Read each part of the assignment carefully, and use the check boxes to ensure you’ve addressed all elements of the assignment!
Learning outcomes
- build effective, responsible, accessible and aesthetically-pleasing maps
- practice manipulating vector and raster data to build multi-layer maps
- practice making maps in R, specifically using
tmap
Instructions
- Create a new GitHub repository.Be sure to include a README that follows these guidelines
- Download data from here
- Unzip data and place in repository
- Add the data to your
gitignore! - Create a Quarto document with responses
- Render your quarto document as a pdf and submit on Gradescope
- Fill out this google form to submit your Github repo link
Your repository should have the following structure:
EDS223-HW2
│   README.md
│   HW2.qmd
│   Rmd/Proj files
│
└───.gitignore
     └───data
         └───ejscreen
         └───SWITRS_LA
         └───mapping-inequality
Background
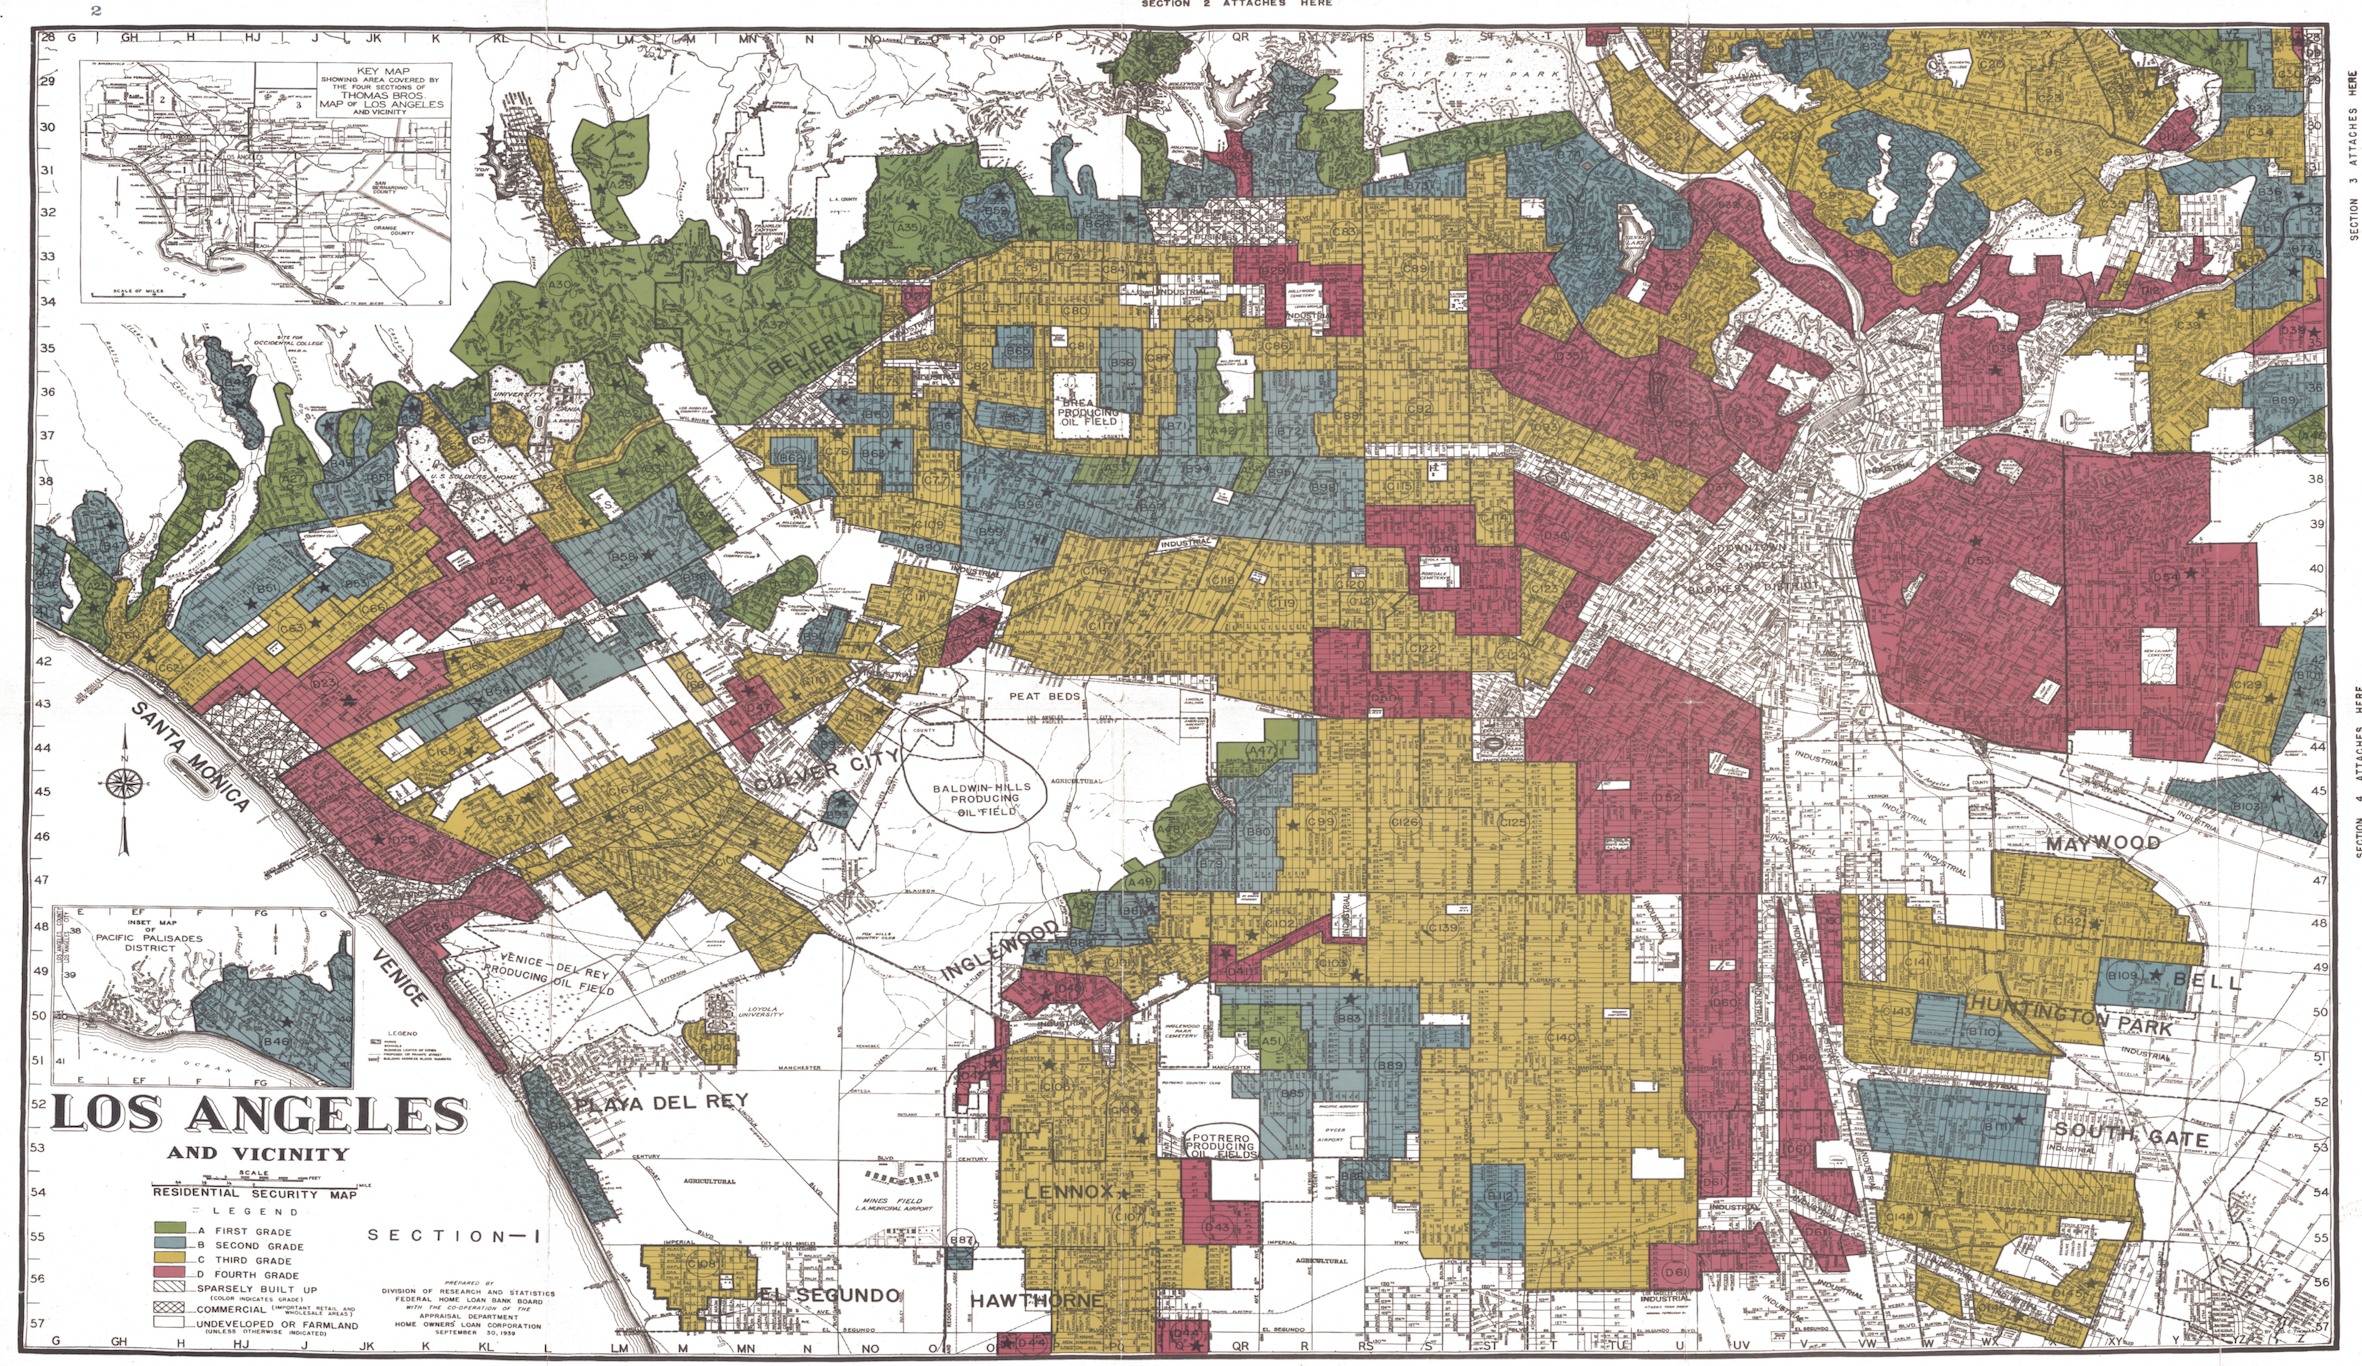
Present-day environmental justice may reflect legacies of injustice in the past. The United States has a long history of racial segregation which is still visible. During the 1930’s the Home Owners’ Loan Corporation (HOLC), as part of the New Deal, rated neighborhoods based on their perceived safety for real estate investment. Their ranking system, (A (green), B (blue), C (yellow), D (red)) was then used to block access to loans for home ownership. Colloquially known as “redlining”, this practice has had widely-documented consequences not only for community wealth, but also health.1 Redlined neighborhoods have less greenery2 and are hotter than other neighborhoods.3
Check out coverage by the New York Times.
A recent study found that redlining has not only affected the environments communities are exposed to, it has also shaped pedestrian safety outcomes decades later.4 Analyzing over 52,000 pedestrian fatalities across 202 U.S. cities from 2010–2019, Taylor and co-authors found a clear pattern: as HOLC grades deteriorated from A (Best) to D (Hazardous), pedestrian fatality rates increased systematically. Census tracts graded “D” experienced 2.6 times the rate of pedestrian deaths compared to “A”-graded areas. These findings highlight the need for targeted pedestrian infrastructure investments in historically redlined neighborhoods to address longstanding safety disparities.
Check out the study on PMC.
Data details
EJScreen
Data file: ejscreen/EJSCREEN_2023_BG_StatePct_with_AS_CNMI_GU_VI.gdb
We will be working with data from the United States Environmental Protection Agency’s former EJScreen: Environmental Justice Screening and Mapping Tool. This tool is no longer operating, but you can find an unofficial version of it here
According to the former US EPA website:
The tool, when in existence, was intended to support research and policy goals. It was shared with the public to achieve the following:
- to be more transparent about how we consider environmental justice in our work,
- to assist our stakeholders in making informed decisions about pursuing environmental justice and,
- to create a common starting point between the agency and the public when looking at issues related to environmental justice.
EJScreen provided on environmental and demographic information for the US at the Census tract and block group levels. You will be working with data at the block group level that has been downloaded from the EPA site. To understand the associated data columns, you will need to explore the following in the data folder:
- Technical documentation:
ejscreen-tech-doc-version-2-2.pdf - Column descriptions:
EJSCREEN_2023_BG_Columns.xlsx
HOLC Redlining
Data file: mapping-inequality/mapping-inequality-los-angeles.json
A team of researchers, led by the Digital Scholarship Lab at the University of Richmond have digitized maps and information from the HOLC as part of the Mapping Inequality project.
We will be working with maps of HOLC grade designations for Los Angeles. Information on the data can be found here.5
Bike and Pedestrian Crash Reports
Data file: crashes.csv
The Statewide Integrated Traffice Records System (SWITRS) database collects and processes data gathered from a collision scenes. The data is hosted on the Transportation Information Mapping System (TIMS), developed by UC Berkley SafeTREC. Metadata can be found on the SWITRS Codebook.
We will be working with crash reports from 2020- 2025.
Tip
Make sure to check that these datasets have the same coordinate reference systems! If not, transform them to match.
Part 1: Legacy of redlining in current environmental (in)justice
Your first task is to explore historical redlining in Los Angeles and its legacy on present-day environmental justice.
Description
For this assignment, you must complete the following:
- Create a map of historical redlining neighborhoods, including:
- Create a table summarizing:
- Create at least two visualizations summarizing current conditions (from the EJScreen data) within HOLC grades using the mean of the following variables (you may combine variables in a single visualization or look at a single variable per plot):
- Write a brief paragraph reflecting on these results
Part 2: Legacy of redlining in pedstrian and bike accidents
Your second task is to explore the legacy of historical redlining in Los Angeles on the report of pedestrian and bike crashes/ fatalities.
Description
For this assignment, you must produce the following based on observations from 2020-2025:
A figure summarizing the percent of observations within redlined neighborhoods within each HOLC grade
Create a visualizations that shows:
Rubric (specifications)
Assignments will be deemed “Satisfactory” based on the following criteria:
Data analysis
-
- custom warning and error message (e.g.
warning()andstop(); resources from EDS 221) - informative comments (resource from EDS 220)
- BONUS: unit tests (e.g. using
{testthat}; resources from EDS 221)
- custom warning and error message (e.g.
Plots, tables, and maps
-
- an informative title
- legends with legible titles, including units
- color scales that are accessible (i.e. make intuitive sense) and appropriate to the data (i.e. discrete vs. continuous)
- for maps: indication of scale and orientation (i.e. graticules/gridlines or scale bar and compass), and an appropiate basemap included where necessary
- All tables should be rendered with legible titles and styling (e.g.
{gt})
Written reflections
Professional Output
-
- see examples of professional and unprofessional output on the Assignments page
Footnotes
Gee, G. C. (2008). A multilevel analysis of the relationship between institutional and individual racial discrimination and health status. American journal of public health, 98(Supplement_1), S48-S56.↩︎
Nardone, A., Rudolph, K. E., Morello-Frosch, R., & Casey, J. A. (2021). Redlines and greenspace: the relationship between historical redlining and 2010 greenspace across the United States. Environmental health perspectives, 129(1), 017006.↩︎
Hoffman, J. S., Shandas, V., & Pendleton, N. (2020). The effects of historical housing policies on resident exposure to intra-urban heat: a study of 108 US urban areas. Climate, 8(1), 12.↩︎
Taylor, N. L., Porter, J. M., Bryan, S., Harmon, K. J., & Sandt, L. S. (2023). Structural racism and pedestrian safety: Measuring the association between historical redlining and contemporary pedestrian fatalities across the United States, 2010–2019. American Journal of Public Health, 113(4).↩︎
Robert K. Nelson, LaDale Winling, Richard Marciano, Nathan Connolly, et al., “Mapping Inequality,” American Panorama, ed. Robert K. Nelson and Edward L. Ayers, accessed October 17, 2023, https://dsl.richmond.edu/panorama/redlining/↩︎